Creating More Content With Less Return? You’re Not Alone
August 10, 2015
Not all content marketing is created equal. To get to the heart of the “habits and behaviors” of effective digital marketers, Adobe used over 490 billion Facebook post impressions, 525 billion Google and Yahoo! Bing ad impressions, and 2 million social streaming app mentions (like Meerkat and Periscope) for their Q1 2015 Digital Advertising Report.
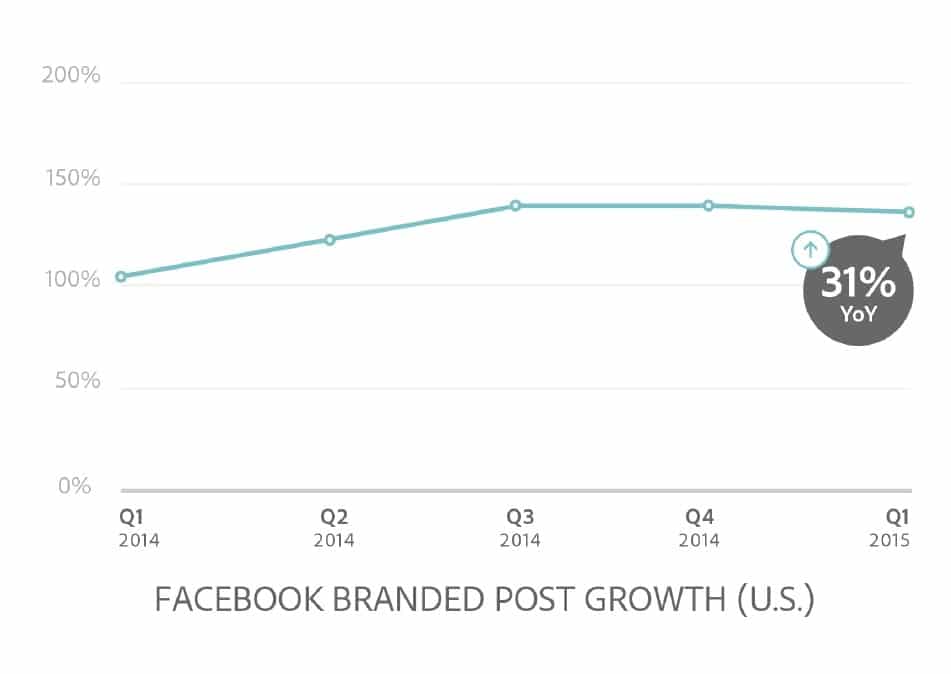
Reinforcing the findings from The Content Marketing Paradox, the results from Adobe indicate that brands are generating more content, but facing diminishing returns for their efforts. On Facebook, for example, Adobe found that brand posting is up 31% year-over-year (Q1 2015 vs. Q1 2014).
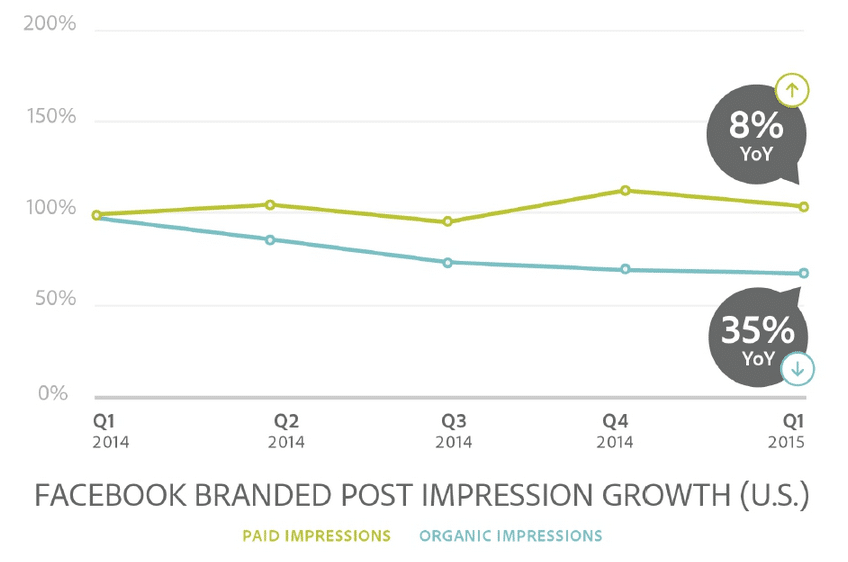
 Across the same time period, however, organic impressions of branded Facebook posts dropped by 35%. Paid impressions have grown, but not commensurately, growing only 8%.
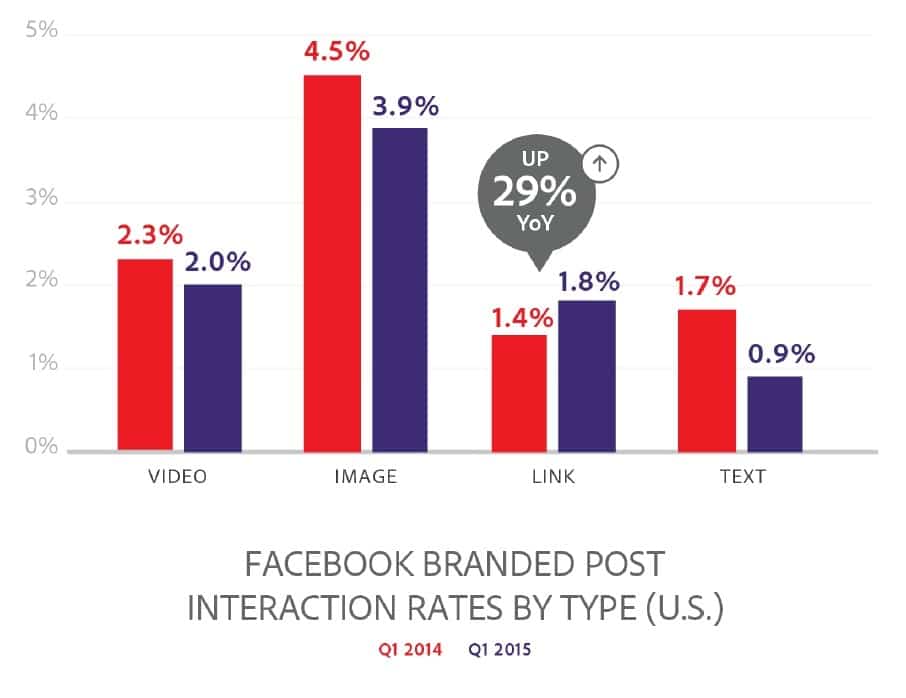
When Adobe broke down these results by the type of post on Facebook, all categories but link posts demonstrated declines. Engagement with video content fell across 2014 from 2.3% to 2%, despite News Feed algorithm changes and features like auto-play videos and a new recommendation interface. Image posts remain the post type with the highest interaction rate on Facebook.
 Adobe attributes the decline in organic impressions to modifications to the News Feed algorithm. But in comparing the results to data from TrackMaven’s Content Marketing Paradox report, we can see that the decline in engagement with branded content isn’t restricted to Facebook alone.
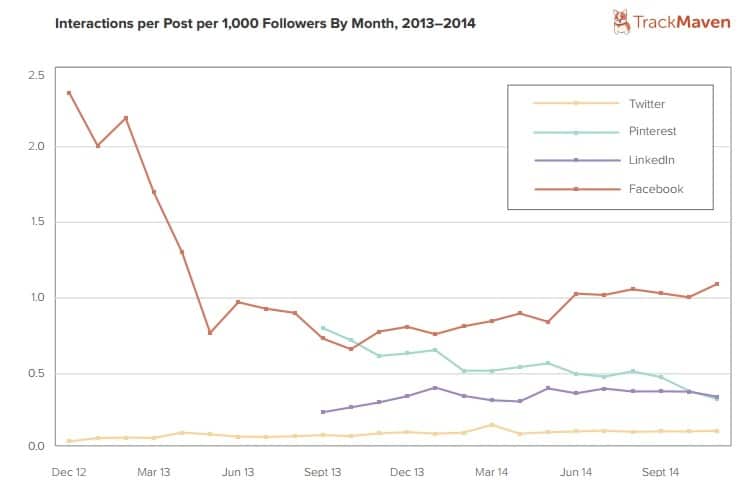
The graph below displays the average interaction per post per 1,000 followers for a sample of 8,800 B2B and B2C brands over time. In addition to Facebook, Twitter, Pinterest, and LinkedIn all saw declining engagement ratios across 2013 and 2014.
The big picture is best expressed by the following graph. From January 2013 through December 2014, the output of marketing content per brand (teal) rose dramatically upwards, while engagement per post (purple) plummeted.
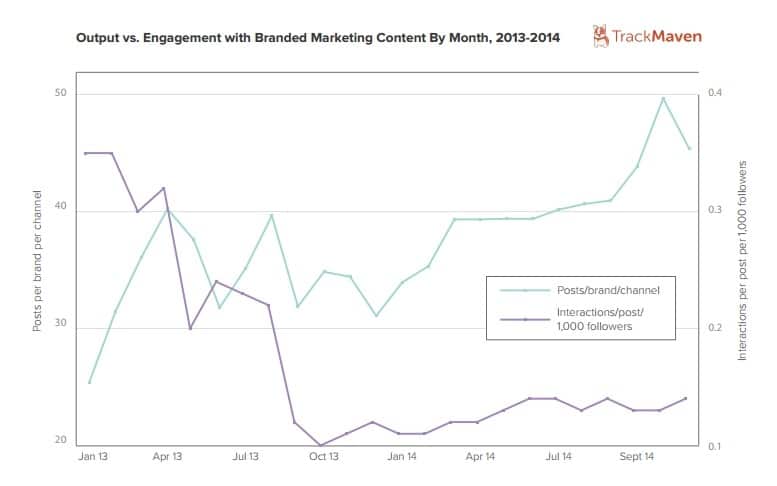
Overall, brands increased their posting frequency by 78% while interactions per post per 1,000 followers dipped by 60%. More content does not guarantee better results, and many brands are finding out the hard way.
Want to produce better content through data-driven insights? Check out TrackMaven here.