Learn the Secrets Behind 45 SaaS IPOs
January 8, 2015
IPOs are generally regarded as the idealized jackpot when it comes to venture-backed exits. That’s because going public, as opposed to being acquired, tends to offer superior growth opportunities and a shot at becoming a market leader as a standalone company rather than a component of another. However, there are other instances when an offer from a strategic partner is just too sweet to pass up, or when it’s not possible or likely to take a company to the next level without joining forces with an incumbent.
Still, there’s no denying the allure of an IPO and the example successful public companies set for today’s startups. What attributes are common among these companies and what trends become visible over time? We can use data from the S-1s of 45+ public SaaS companies to observe several things, such as number of founders to market cap, trends in founders’ equity over time, and revenue growth to years it took to go public.
Is Number of Founders a Tell-Tale Sign of Success?
To start, let’s observe average market capitalizations by number of founders associated with each company: 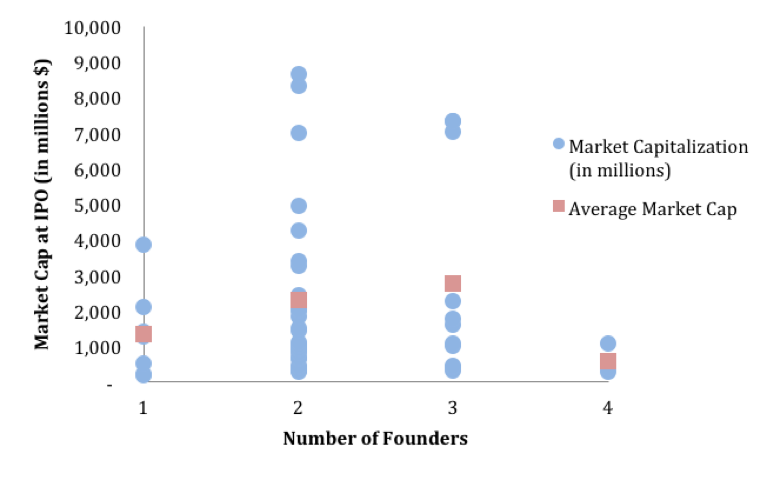 You may have recently heard Reid Hoffman, Peter Thiel, and many others reiterate the importance for companies having more than one founder. In their experiences, companies with a lone founder have far less success than those with multiple co-founders. Our data proves their theory true. But how many is too many, and what is the perfect number? As the chart above illustrates, fewer companies on the list have one founder or four co-founders. The majority have two or three. And while each company in the list is venerable for having gone public in the first place, those with four co-founders possessed the lowest average market capitalization at the time of filing, followed by companies with only one founder. Meanwhile, companies with either two or three founders have, on average, built the largest B2B SaaS companies (at the time of their filing).
Of course, it would be foolish to choose co-founders based on this anecdotal data, and this post isn’t meant to provide a recipe for success. However, the observation emphasizes the importance of the diverse backgrounds, skills, and personalities needed to build a successful company. Note: Chart does not include information for companies with more than 4 founders.
How Fast Are Companies Growing When They Go Public?
Next, we compare the years it took a company to go public and the growth rate it experienced prior to filing its S-1. The growth rate considered averages for each company’s reported rates in the three years prior to filing: ![]() The time it takes a company in the data set to file an S-1 ranges from 4-14 years, with the majority of companies dispersed in the 6-12 year range. As one might expect, companies that are quicker in filing for an IPO tend to boast higher average growth rates. It’s worth noting, however, that our sample sizes for the quickest and slowest companies were very small. Nevertheless, the trend holds.
The time it takes a company in the data set to file an S-1 ranges from 4-14 years, with the majority of companies dispersed in the 6-12 year range. As one might expect, companies that are quicker in filing for an IPO tend to boast higher average growth rates. It’s worth noting, however, that our sample sizes for the quickest and slowest companies were very small. Nevertheless, the trend holds.
Do Market Trends Impact Splits Between Founder and VC Equity Ownership?
Finally, have trends in founders’ equity ownership or VC equity ownership changed over time? Not according to the data: ![]() My initial hypothesis was that founder equity would vary over time and would be somewhat correlated with the state of the venture market. When the market is inflated, I thought, entrepreneurs would charge higher equity premiums and thus sell off smaller portions of their companies. My thesis turned out to be incorrect: founders’ retained equity hasn’t shown any consistent trends over time. There is a wide range, from a low of 4% to a high of 73% ownership at the time of an S-1 filing, but the median equity ownership for founders at the time of their company’s IPO is 15%.
My initial hypothesis was that founder equity would vary over time and would be somewhat correlated with the state of the venture market. When the market is inflated, I thought, entrepreneurs would charge higher equity premiums and thus sell off smaller portions of their companies. My thesis turned out to be incorrect: founders’ retained equity hasn’t shown any consistent trends over time. There is a wide range, from a low of 4% to a high of 73% ownership at the time of an S-1 filing, but the median equity ownership for founders at the time of their company’s IPO is 15%.
Entrepreneurs use equity not only in exchange for the several cash injections needed to grow their businesses, but also as parts of compensation packages offered for employees and independent board directors. It isn’t surprising that in some cases founders need to exchange as much as 85% of their company in order to build a market leading business. My initial theory may have been flawed because founders can have a propensity to raise more money than necessary when they’re able to charge premiums on equity. It can be nice to have extra cash on hand in case a bull market takes a turn for the worse. VC equity over time: ![]() Similar to founders’ equity over time, there aren’t any clear trends in VC equity ownership of venture-backed B2B SaaS companies. The median aggregate venture capital stake in a company by the time it files to go public is 65%, which is considerably higher than what founders retain.
Similar to founders’ equity over time, there aren’t any clear trends in VC equity ownership of venture-backed B2B SaaS companies. The median aggregate venture capital stake in a company by the time it files to go public is 65%, which is considerably higher than what founders retain.
Bottom Line
There are several other metrics to consider when measuring your company’s health and setting goals. Hopefully this set provides founders with a few valuable nuggets to understand how their companies stack up against some of the most successful SaaS businesses of our time. Feel free to offer suggestions for any other metrics you’d find valuable to measure your numbers!