Armchair Data Science: Exploring SaaS Growth and IPOs
May 31, 2013

Mention the term ‘data science’, and it usually conjures up thoughts of dense statistical analysis and time-intensive number crunching.
Although that may be true to an extent, I believe the real core of data science does not need to be too technically complex nor time consuming. Rather, I think the real value from data science comes from exploring data to glean some sort of insight — asking crazy questions of the data and seeing if it can spit back an answer at you if you twist it the right way.
Over the past few weeks, we compiled information on twelve enterprise SaaS and software companies that went public in 2012 and 2013 and decided to do just that. Here are three questions we asked to take a closer look at the drivers of SaaS IPOs and growth.
1) What is the real nature of the relationship between sales & marketing expenditure and revenue growth?
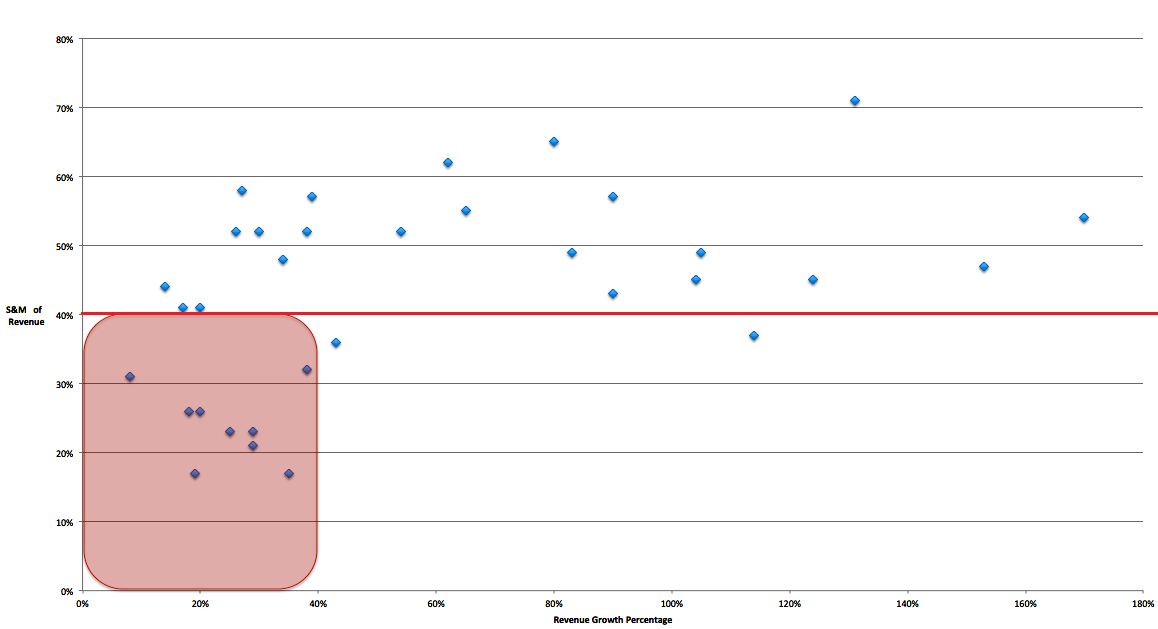
There is a very interesting trend when you plot the revenue growth rate against the sales and marketing percentage of revenue for each year for each of the companies we looked at.
As a brief explanation, S&M of revenue percentage indicates how much a company is putting into growing their customer base — intuitively, it makes sense that companies pay more for advertising and make more sales calls when they are trying to get more customers. The reason for dividing the amount spent on sales and marketing by the total revenue (ultimately giving you S&M of revenue percentage) is to provide a better comparison of S&M expenditure between companies of different size.
When a company has an S&M of revenue percentage under forty percent, there are only two instances in our data where revenue growth rate exceeds forty percent, and one of them just barely exceeds the limit.
In general, exceeding forty percent for S&M of revenue does not automatically result in significantly higher revenue growth rates — the distribution above the red line as seen on the graph makes that pretty clear.
Key Takeaway: However, for companies to even have a shot at a revenue growth rate above forty percent, it is almost a necessity to ratchet up S&M of revenue percentage higher than forty percent.
2) What do SaaS IPO revenue levels and VC investment have to do with each other?
Another interesting statistic we tried out was the following ratio: Annual Revenue when IPO ($MM)/Total Investment ($MM). The deviation between the highest and lowest numbers here was pretty large: the maximum data point was about 16.5 and the minimum was at .6. However, the average of about 3.3 and the median around 1.1 are much more representative of what seems to be going on.
Key Takeaway: In general, companies in this space can expect to IPO at annual revenue roughly equal to the amount of investment capital they take on, providing a worthwhile return to the investors who catalyzed the company’s growth.
3) How long does a company keep their foot on the sales & marketing gas pedal?
The last comparison we made was looking at the relationship between S&M of revenue percentage and the operating income. Operating income tells us if — after subtracting costs of good, wages, and all of the costs of running a business from revenue — a company is profitable or not.
For each of the companies we looked at, those with a negative operating income (still not profitable) had much higher than average S&M of revenue percentages. And this makes sense, because companies that are spending a lot of money and trying to achieve high revenue growth percentages will be spending that money on sales and marketing, the source of customer base growth for a company.
Key Takeaway: From this comparison, it’s clear that some companies are really jacking up their sales and marketing efforts to continue driving revenue growth as fast as they can. On average, companies with an annual negative operating income had an S&M of revenue percentage of 52 percent and those with a positive operating income had an S&M of revenue percentage of 38 percent.
Data science, as awesome as it is, of course is not perfect. In looking at this question, there was no clear indication of when or why companies would eventually slow down their S&M of revenue percentage, which would subsequently bring down their operating costs and assumingly make them a profitable company.
So what do you think? Of course revenue growth rates plays a part, but at what point do companies take their foot off the sales & marketing gas pedal and move into profitability?