Customer Segmentation: A Step-by-Step Guide for Growth
May 13, 2021
To scale efficiently and effectively, expansion-stage companies need to focus their efforts on a specific subset of customers who are most similar to their best current customers, not a broad universe of potential customers. Customer segmentation is the way.
Table of Contents
- What is customer segmentation and why does it matter?
- Establish segmentation hypotheses and variables
- Explore B2B customer segmentation schemes
- Benefits of customer segmentation
- Creating change your company can believe in
- 5 steps to customer segmentation
- Putting this into practice
What is customer segmentation and why does it matter?
Also known as market segmentation, customer segmentation is the division of potential customers in a given market into discrete groups. That division is based on customers having similar:
- Needs (i.e., so a single whole product can satisfy them)
- Buying characteristics (i.e., responses to messaging, marketing channels, and sales channels, that a single go-to-market approach can be used to sell to them competitively and economically)
There are three main approaches to market segmentation:
-
- A priori segmentation, the simplest approach, uses a classification scheme based on publicly available characteristics—such as industry and company size—to create distinct groups of customers within a market. However, a priori market segmentation may not always be valid since companies in the same industry and of the same size may have very different needs.
- Needs-based segmentation is based on differentiated, validated drivers (needs) that customers express for a specific product or service being offered. The needs are discovered and verified through primary market research, and segments are demarcated based on those different needs rather than characteristics such as industry or company size.
- Value-based segmentation differentiates customers by their economic value, grouping customers with the same value level into individual segments that can be distinctly targeted.
This guide will focus on the value-based approach, which allows expansion-stage companies to clearly define and target their best prospects (based on its current knowledge of the market) and satisfy most of their needs for segmentation in the expansion stage—without consuming the time and resources of a traditional, descriptive segmentation research process.
Don’t have time to read it now? Check out our quick 10-step approach to customer segmentation.
Establish segmentation hypotheses and variables
While most companies possess enough market knowledge to predict or anticipate which customer segments are their most profitable, the leaders of those businesses also know that scaling a business is not best left to guesswork or instinct. That’s why, in a customer segmentation process like the one described in this guide, it’s critical to develop customer segment hypotheses and variables, and then validate them with a well-developed, scientific research process.
That’s particularly true in needs-based and value-based segmentation schemes, where it’s impossible to utilize a customer segmentation process without first establishing clear hypotheses that will serve as the foundation of your research. Ultimately, hypotheses should be formed around customer characteristics or factors that allow you to clearly separate your current customers into distinct needs-based or value-based segments. While your hypotheses do not need to be complicated mathematical or statistical statements, they should be clear and logical enough to be testable and useful.
For example, a typical hypothesis might look like this:
- Customers with revenues of $1 million tend to be in segment A
- Customers with revenues of less than $1 million will be in a different segment from customers with more than $1 million in revenues
- Customers with more than $1 million in revenues tend to be of higher value (or are part of a higher value segment)
Using that example, the segmentation variables can be defined as the objective measures, factors, or characteristics that help you differentiate segments, whether they are needs- or value-based. In the above scenario, those variables focus on financial information, but they could just as well pertain to the customer’s reputation, online presence, or business model, depending on what is most relevant to the segment.
Developing variables and hypotheses is important for a variety of reasons, but its primary purpose is to provide a framework for the customer segmentation research process. Once you have established a clear hypothesis and the variables that you need to test, you can begin executing the intricate process that will help you identify your best current customer segments.
Explore B2B customer segmentation schemes
As with most business initiatives, the goals and outputs of customer segmentation research will likely depend on your company’s stage, market conditions, and myriad other variables. However, there are some relatively standard schemes that coincide—or at the very least overlap—with most needs-based or value-based segmentation initiatives.
For example, here are six standard segmentation schemes that could be applied to your customer segmentation research:
- Geographic base / reach
- Industry / sub-industry / industry served / customer served
- Product class / product usage
- Organization size (measured by revenue, number of employees, etc.)
- Product delivery model / product or packaging format / special technology / process methodology
- Special use / needs
It is important to note that even if a market is divided into one of the schemes above, it is still not a valid segmentation of the market unless it results in meaningful differences in customers’ values and needs, the company’s value proposition, or the go-to-market strategy associated with each scheme. In such cases, it is merely a convenient organization of the market that has no strategic or operational value.
Benefits of customer segmentation
At the expansion stage, executing a marketing strategy without any knowledge of how your target market is segmented is akin to firing shots at a target 100 feet away—while blindfolded. The likelihood of hitting the target is a matter of luck more than anything else.
Without a deep understanding of how a company’s best current customers are segmented, a business often lacks the market focus needed to allocate and spend its precious human and capital resources efficiently. Furthermore, a lack of best current customer segment focus can lead to diffused go-to-market and product development strategies that hamper a company’s ability to fully engage with its target segments. Together, all of those factors can ultimately impede a company’s growth.
If best current customer segmentation is done right, however, the business benefits are numerous. For example, a best current customer segmentation exercise can tangibly impact your operating results by:
- Improving your whole product: Having a clear idea of who wants to buy your product and what they need it for will help you differentiate your company as the best solution for their individual needs. The result will be increased satisfaction and better performance against competitors. The benefits also extend beyond your core product offering, since any insights into your best customers will allow your organization to offer better customer support, professional services, and any other offerings that make up their whole product experience.
- Focusing your marketing message: In parallel with improvements to the product, conducting a customer segmentation project can help you develop more focused marketing messages that are customized to each of your best segments, resulting in higher quality inbound interest in your product.
- Allowing your sales organization to pursue higher percentage opportunities: By spending less time on less lucrative opportunities and more on your most successful segments, your sales team will be able to increase its win rate, cover more ground, and ultimately increase revenues.
- Getting higher quality revenues: Not all revenue dollars are created equal. Sales into the wrong segment can be more expensive to sell and maintain, and may have a higher churn rate or lower upsell potential after the initial purchase has been made. Staying away from these types of customers and focusing on better ones will increase your margins and promote the stability of your customer base.
Conducting best current customer segmentation research can have numerous other ancillary benefits, of course, but this guide will focus primarily on how it can impact the four cited above. The bottom line is that if you are able to sell more of your product to your most profitable customers, then you will be able to scale the business more efficiently and ensure that everything you do — from lead generation to new product development — revolves around the right things.
Creating change your company can believe in
This first step toward creating meaningful change in an organization is acknowledging that change is needed. For a technology company moving from the startup stage to the expansion stage, that often means abandoning a non-discriminatory, “take every customer we can get” approach, and replacing it with a far more targeted, best current customer segment strategy.
Executing a customer segmentation research process is the first step toward helping a growing company make that transition. Ultimately, best current customer segmentation can help your business better define its ideal customers, identify the segments that those customers belong to, and improve overall organizational focus.
5 steps to customer segmentation
In order to help you identify your best current customer segments, we’ve broken the process down into five clear steps, from setting up your project to performing customer data analysis, executing data collection, conducting customer segment analysis and prioritization, and incorporating the results into your organizational strategy.
While recognizing that being able to identify your best current customer segment can help your business is important, it is meaningless unless you act on it, or if you engage in segmentation activities that are more distracting than helpful.
To be effective, you need to execute a best current customer segmentation process that is driven by a clearly defined set of objectives and outputs, and is backed by all of the company’s relevant stakeholders. This guide will help you accomplish those tasks.
The systematic and scientific data collection and analysis processes laid out in this guide might seem complicated, but they are not impossible to manage. Like almost any initiative, you simply need to ensure that key players and shareholders remain focused on their specific roles and responsibilities, and work collectively to achieve a clearly defined set of goals and objectives.
Step 1: Setting up your customer segmentation project
As with any project, preparation is essential. Without it, your initiative will lack focus and direction, which can ultimately take you off course. So let’s make sure your ducks are in a row.
To determine your best current customer segment, begin by defining the project and planning for it appropriately. To do that, you first need to have a crisp understanding of its:
- Objective: The ultimate business goals that completing the project will address or contribute to. Ideally, these goals will overlap or be aligned with your company’s strategic goals.
- Stakeholders: The senior staff from the various departments and teams (e.g., product management, marketing, sales, customer support, professional services, operations, etc.) whose goals will be directly affected by the outcome of the project, and who will therefore be invested in the project’s success.
- Scope: The project’s parameters, which can be built around its inputs (e.g., the percentage of customer accounts to be analyzed or the number of segmentation hypotheses to be tested) or its outputs (e.g., the maximum number of segments to be identified or the maximum number of segments or the percentage of segments to be analyzed). Other examples of scope parameters include the amount of resources and/or time spent on the whole project or each stage of it.
- Deliverables: The project’s outputs, whose format and organization need to be clearly specified at the beginning of the project. While all of the project’s stakeholders will be looking for high-quality, rigorous analysis, the format that the ultimate deliverables take can significantly affect the output’s acceptance and effectiveness. The project sponsor is responsible for thinking of the most suitable format for the deliverables and to plan ahead about how they can be used on an ongoing basis. Typical deliverables might include:
- A presentation highlighting key findings, including but not limited to:
- A list of the top customer segments identified and verified through the analysis
- Additional insights into these segments
- A representative list of customers within those selected segments
- A list of recommended next steps
- A file containing the data and analysis that support the main conclusions in the presentation
- Data file(s) containing the original inputs and intermediate files, as well as auxiliary output files (for recordkeeping purposes)
- A presentation highlighting key findings, including but not limited to:
Creating a work plan
Before executing the project, it is also important to have two sets of plans: a high-level outline and a work plan. The outline should detail the basic steps, methodology, and timeline of the project. It is a document that the project’s stakeholders should review and approve.
By contrast, the work plan is a much more detailed document that elaborates significantly upon the outline, typically breaking steps down into specific tasks that clearly indicate what needs to be done and what the related inputs and outputs are. The work plan also has to incorporate various internal touchpoints that happen internally between everyone involved in the project.
The work plan should reflect inputs on key tasks as well as suggestions and specifications for outputs at key internal review steps. It should also ensure that the methodology behind the main analytical tasks is consistent with the project’s overall methodology. The detailed work plan should then be used to estimate the time required for each task (in hours or days), project step (in days or weeks) and the whole project (in weeks). Given that the time estimate may not be 100 percent correct at the task level, expect some discrepancies between the estimated length of the project and the actual time it takes to complete.
During the course of the project, there will invariably be unplanned diversions and other changes that need to be reflected in the work plan. Major changes to steps in the project or the project’s methodology should always be vetted by the stakeholders and fully documented in the updated work plan.
Getting buy-in from the executive team
To have true impact, a customer segmentation exercise — and specifically its outputs — need to be incorporated into your company’s go-to-market strategy. This is because, in many cases, selecting a top segment can actually kickstart the execution of a companywide go-to-market strategy. However, you will only achieve that level of impact if your company’s executive team is a true stakeholder in the project.
The way to secure their buy-in is by getting them to understand that:
- Selecting and focusing on a segment is a strategic imperative.
- Conducting a best current customer segmentation exercise — which is distinct from other types of segmentation analysis—is the best way to meet that imperative.
- The methodology being used, and the planned inputs and outputs of the project, are appropriate.
To ensure the executive team’s buy-in across these areas, it is important to actively articulate the benefits of best current customer segmentation. Be extremely transparent about the methodology and process steps involved in the project so that your stakeholders are always aware of any changes in the process that might make them reconsider their commitment to the overall project.
Additional best current customer segmentation prerequisites
Developing a customer list
The project scoping and definition exercise continues by developing an account list to use as your data set. Built from a customer relationship management or billing database, the list needs to be comprehensive and include all of your customers with the exception of test and proof of concept (POC) accounts.
Note that any company’s customer base will contain outliers — customers with very special characteristics, deal structure, or conditions — which must be carefully considered before deciding whether or not to keep them in your analysis. Keeping the outliers in the analysis can be a disadvantage, skewing average values and expanding the variance of the data under analysis, thus reducing the precision of the results, and highlighting one-offs while disguising underlying trends.
Consider the following points as you seek to reduce your full customer list into one that is more conducive to statistical analysis:
| Action | Examples |
|
|
|
|
|
|
|
|
Defining customer quality or value
The purpose of your analysis is to identify common characteristics that define good customers. To do that well, you need to clearly and objectively define what good means by developing a quality score that you can use to objectively rank your customer base.
In the purest sense, customer value is the total net present value of the cumulative profits generated by a customer over their lifetime. Naturally, you won’t have data on the future behavior of your current accounts, so you will have to make certain assumptions about the future, and fill in missing data with averages based on the data you do have. Practically speaking, it is very hard to calculate or even approximate this, especially with the demographics of young, rapidly growing companies.
Another complication is that it is almost impossible to precisely identify all of the non-negligible costs associated with a customer over its lifetime, especially for software as a service (SaaS) companies whose service costs stem from a blend of hosting, bandwidth, customer support, and account management costs. You should not expect the score to include all of these factors completely or to be a precise measure of the value/cost/profits. Nevertheless, the quality score will serve your purposes as long as it captures enough of the differences between what your organization considers poor, average, and great customers, and allows you to rank customers based on those measurements.
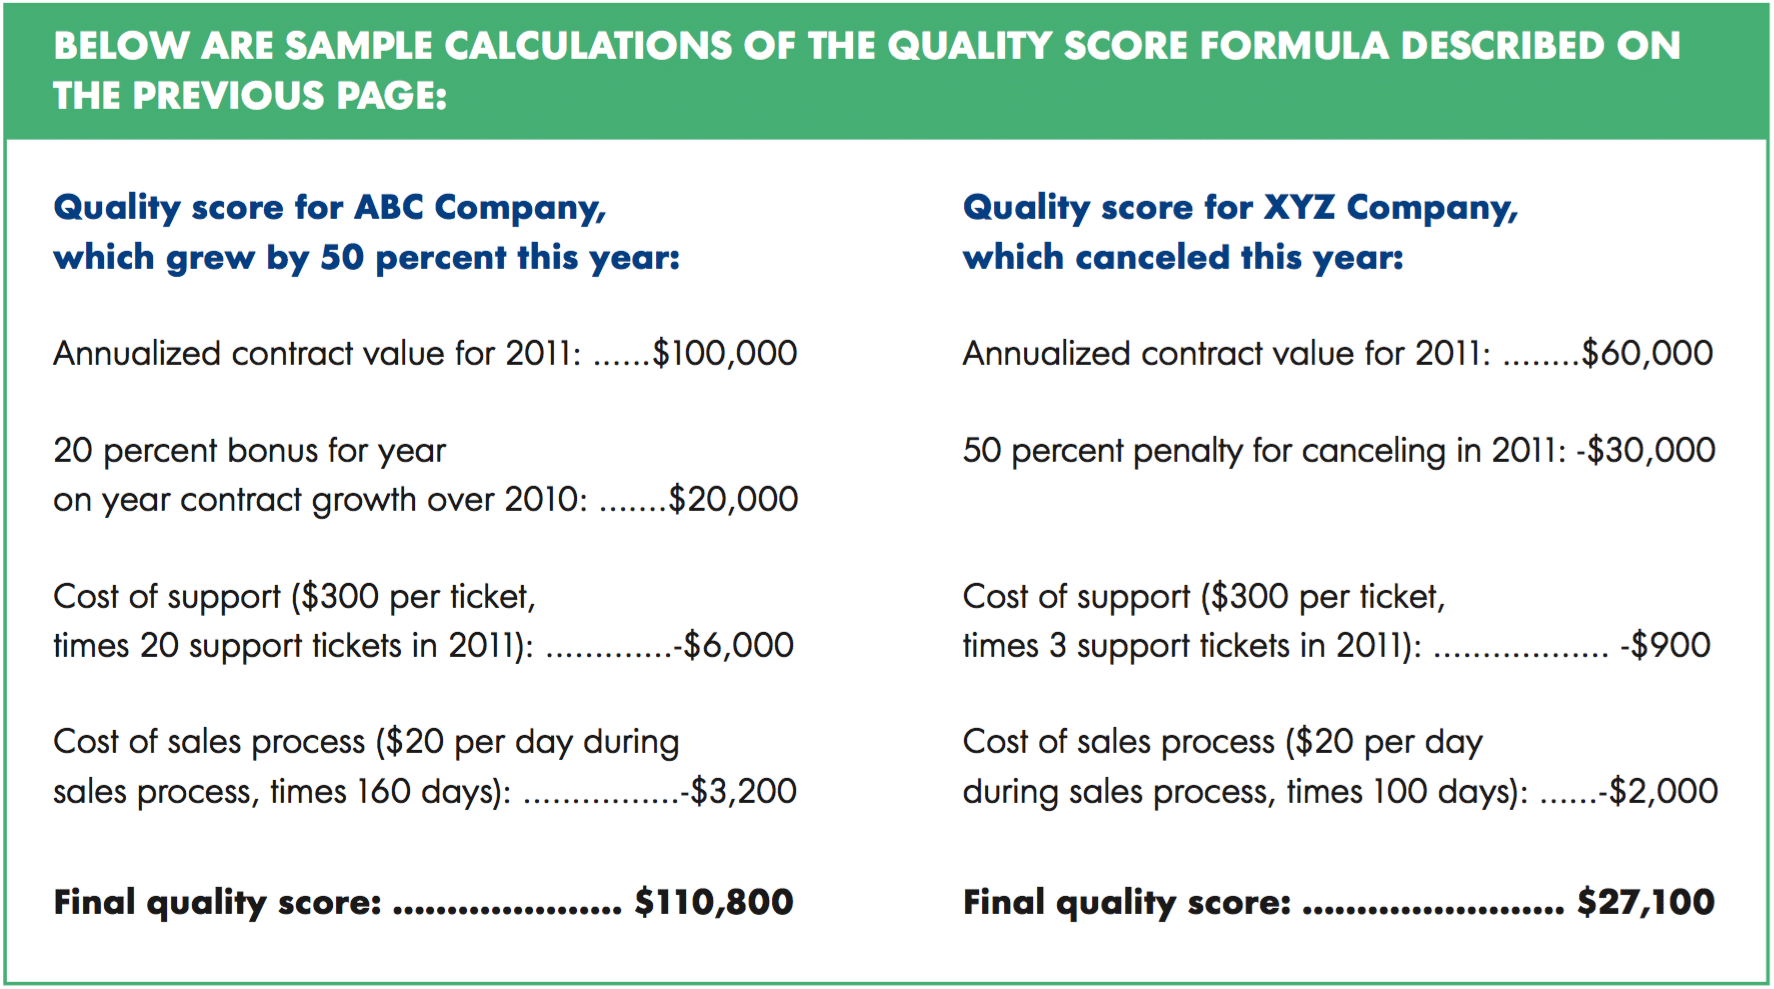
The following example illustrates how to establish a quality score for a software as a service (SaaS) or license-based software vendor:
- Begin with the client’s annualized contract value, taking both current and former customers into consideration.
- Subtract an estimate of the costs directly associated with the account. For a technology company, the gross expenses will be fairly minimal, but should incorporate subtler costs such as:
- Maintenance costs: support tickets, client service payroll expenses, etc.
- Acquisition costs: payroll expenses and costs incurred during sales cycles associated with acquiring that account
- Adjust this score with bonuses and penalties for customer characteristics that hint at the future behavior of the account. Some examples of bonuses and penalties include:
- A bonus for license/revenue growth, which can be represented as a percentage of growth over the last period, or as a scaled score representing the magnitude of growth
- A penalty for cancellation (a fixed reduction of the total score)
- A bonus for marquee customers (to represent their value as a marketing asset)
Such bonuses and penalties are necessary to compensate for less concrete costs and income associated with the account. For example, as noted above, we are not sure how long a current account will stay a customer or at what rate it will renew. However, we can assume that growing accounts are happy and are more likely to renew at a higher rate. As a result, we can reward their score accordingly for that expected future behavior. Likewise, marquee accounts will have an impact beyond their own MRR, so their score should reflect that.
Once you’ve developed a quality score that sufficiently captures these nuances, the next step is to present it to the project stakeholders for their feedback. This is essential because the quality score is the foundation for the rest of the project and everyone needs to generally accept it as an accurate and reliable representation of customer “goodness.”
In the feedback process, you might uncover additional factors that need to be incorporated into the scoring formula (for example, additional usage costs for customers in a particular use case, or additional costs of acquisition for customers in a particular channel). Moreover, reviewing the quality score may also raise concerns about systematic errors in the formula that are obvious to certain stakeholders but not to others. This could mean anything from eliminating costs they don’t think are relevant, to increasing the weighting of a particular bonus or penalty.
Always remember, no matter how thoroughly defined and logical your methodology, the ultimate results of the analysis will not be credible unless all of your stakeholders agree with your proposed ranking of the accounts. Reaching that agreement may be difficult, and will likely require flexibility in your formula and some consensus building so that all of your stakeholders can agree and commit to the methodology.
Step 2: Analyzing customer data
In this section of our guide to customer segmentation we’ll cover everything you need to develop effective research criteria and successfully manage the data collection process.
The next step in the best current customer segmentation process is to develop a formula or set of criteria to measure the attractiveness or value of each customer in your customer base. This formula is determined by the actual economic benefits or net profits/loss that customer has generated over its lifetime. It creates an objective measure that can consistently and objectively be used to compare customers in different segments.
Identifying segmentation hypotheses: What are the characteristics that make a company a good customer?
Once your list of accounts is objectively ranked, start identifying hypotheses for the observable characteristics that could predict their quality.
The hypotheses should represent proposed relationships between customer characteristics and the goodness of the customer, as measured by the quality score. If the company you are analyzing has more of a particular characteristic, it will likely have a higher quality score.
To generate an initial list of such segmentation hypotheses, you’ll need to analyze:
- The structure of the market: Such analysis reviews major market participants to identify the buyers, sellers, providers, and beneficiaries in the company’s value chain. Check to see if there are distinct markets or use cases prevalent in the market. The alignment of the participants along product lines, use case, packaging format, or special offerings might suggest a similar division of your company’s customer base along the same lines.
- Market information residing within the company: Interview your customer-facing staff (sales, marketing, and customer support) to understand the following:
- What are the key selling points that win an account?
- Why do customers generally cancel?
- Who is our marketing directed at and why?
If their answers can be framed as observable characteristics of a company, they can be used as a segmentation hypothesis.
- Market experts and their publications: How do they segment the market? How do they define your market and your competitors?
- Competitive information: Review competitor websites for their marketing messaging, promotions, sales content, and product features. Who are they targeting? Do they segment their website content, messaging, and product lines? If so, why?
- Structurally similar industries: Review industries with similar organizational characteristics to your own market. Doing so can provide clues that reveal special structural characteristics that define its segmentation.
- Standard, a priori segmentation schemes: Consider customer size, customer industry, customer geography, etc.
The ultimate goal of your research and data collection is to determine what makes a good customer for your company or product. At this stage, no segmentation idea is too far-fetched, as long as there is some economic or logical rationale for why it could be true and it is a meaningful prediction that can be validated. You want to capture every angle that might help you segment your customer base.
When conducting interviews within your company, you will want to speak with a cross-section of team members from marketing, product development, and sales. Each function within the organization should have some ideas about who they are designing their marketing message, sales tactics, or product features for, and why those targets would make an attractive customer.
In many early stage companies, these ideas may differ substantially from person to person and function to function. Collect each of their viewpoints and ask a lot of follow-up questions to uncover any hypotheses they might have about customer segmentation.
Your list of ideas will typically include segmentation hypotheses like the following:
- Larger companies make better clients
- Hospitals typically make worse clients
- B2B companies make better clients
- Multinational companies make worse clients
- Companies with large advertising budgets make better clients
- Companies that are more active in social media make worse clients
- Companies with a small IT Team will make better clients
Identifying the data fields and internal or external sources required to test and prioritize the hypotheses
Once you have built a comprehensive list of segmentation hypotheses and have standardized them in the format illustrated above (“companies with more of characteristic X make better/worse clients”), the next step is to devise the appropriate data-driven processes to validate them. This requires you to identify the right data points to support the hypothesis.
You can do so for each hypothesis you have identified by:
- Evaluating the best numerical measure for measuring the hypothesized characteristic X.
- Identifying public data sources that can provide the value of the measure for the companies in your list of customers. If there is no publicly available data source for the particular measure, you have three options to consider:
- Use paid sources (if available and affordable), such as subscriptions to corporate and financial information databases, e.g., Hoovers DNB, InsideView, or CapitalIQ.
- Devise or define a proxy measure that is available through a public source, such as number of online visitors or rankings in Fortune 500 or Inc. 500 lists.
- Consider dropping the hypothesis all together if there is no available source — paid or unpaid — for the data.
- For each of the data sources identified, estimate the cost of collecting the data by considering the cost of the subscriptions as well as the cost of collecting the data for the companies in your customer list (correlated to the time and effort required to collect the data). You can roughly estimate the time costs by carrying out the data collection steps for a few of the companies, using the time spent on those data points as a benchmark.
- Considering the quality and accuracy of the data sources.
- Considering the options for each hypothesis by weighing the total cost of using a data source and the quality, accuracy, and coverage of the sources to decide on the most practical data source and data collection process to use when testing a particular hypothesis. A data source should also be preferred if it provides sufficiently accurate data for multiple hypotheses at the same time.
The example below illustrates this approach:
- Hypothesis: Larger companies make better clients
- Proxy: Company revenues or company employees
- Sources: Manta, LinkedIn, Data.com (free data), or Hoover’s database (paid data)
- Cost of collection: Estimate of time-related cost of using publicly available databases such as LinkedIn or Manta:
- To find company’s number of employees: 3 minutes per data point x 100 customers = approximately 5 hours
- To find company’s revenues: 4 minutes per data point x 100 customers = approximately 6.5 hours
Either task can be completed by an intern for approximately $75 to $130 assuming they earn between $15 to $20 per hour.
Using Hoover’s as a data source for either revenue or number of employees has no time cost associated with it, but rather a data purchase cost: $6 per record x 100 records = $600.
Based on this comparison, it would be better to use an intern to collect the publicly available data. However, in cases where multiple data points can be collected using Hoovers data source with no additional cost, doing so might be worthwhile.
For less quantifiable data collection tasks, you can use a scale system, for example from 0 to 5, where 0 denotes no effort required, and 5 denotes massive effort required for each data point.
Once you have identified the hypotheses that are testable with viable sources, your constraint becomes research capacity. You will need to prioritize the set of hypotheses you have documented to identify whatever subset will provide the most practical and impactful segmentation insights.
As noted above, you will find that for some of your more detailed hypotheses, there will not be a suitable proxy, or that proxy will be too difficult, expensive, or unreliable to collect. In such cases, deprioritize them, at least in the first round of analysis, for two reasons:
- The cost of data collection to verify the hypothesis can be prohibitive
- Even with the data, the value of insights to be gained from validating a segmentation hypothesis will be hard to put into practice given how difficult it is to measure the supposed segmentation variable
The output of this step should be a final list of hypotheses to be tested, data fields to be collected for each test, and the sources of that data.
Step 3: Data collection
The next step is to build a comprehensive list of ways of using the customer characteristics you have identified to distinctly classify your current customer base by attractiveness. This is done using inputs and recommendations informed by the company’s staff, experts, and customers, as well as research on competitors. It is important to be as comprehensive as possible because effective differentiating factors can go beyond typical schemes such as company industry, company size, or geographic region.
Managing the data collection process
Best practices for managing a research team
- Ensure proper and consistent documentation of the input and output specifications for each research task.
- Leverage overlapping data collection needs for different segmentation hypotheses: the same data field can be used in testing multiple hypotheses.
- Document research tasks—even the most minute details—as each one has a tremendous impact on the quality of the data.
- Establish a regular working rhythm with the team that includes reviewing the outputs, allocating new research tasks, and resolving any impediments.
- Consider establishing a separate sub team of researchers to focus on data quality assurance and require that all research outputs be vetted by the team.
- Use a collaboration and document sharing tool with versioning functionality to better manage the vast number of data fields typically associated with this process.
To collect the data, you need to develop a plan detailing where each variable will be found, and which resource and method will be used to find it. Doing so assumes that you have access to a team of data collectors who will carry out the research, or access to an external data provider that will provide the data you need in the required format.
As the research manager, you will need to work closely with your data collection team throughout this potentially complex research process. Therefore, sharing the research plan with them to get their feedback and support is very important. Their input will make the plan more accurate and realistic, while their support will make the project more efficient.
The data collection work plan and the best practices described in the callout [above] are still relevant even if you do not have access to any additional resources for data collection. When setting up your plan, identify potential weaknesses in the data set and pay special attention to them as the data is collected. These weaknesses might include:
- Incomplete or hard-to-reach data (e.g., revenues for private companies)
- Outdated data
- Data that is not easily standardized or has multiple definitions (e.g., profits are sometimes given as gross profits, EBITDA or operating profits)
- Data that requires qualitative judgment (e.g., industry or business model)
To ensure the quality of the data, conduct quality assurance before, during, and after the data collection process. Problematic data will not only create issues during your segmentation analysis, but also when it is time to generate outbound prospecting lists.
If, based on your review of the preliminary data outputs, you have any doubt about the quality of the data source, consider another proxy or data source. In cases where there is no suitable alternative, go back to the previous step and consider the hypothesis among the full list of prioritized hypotheses.
Step 4: Analysis and prioritization
This section in our guide to customer segmentation will help you conduct the data analysis necessary to evaluate and prioritize your best customer segments.
In order to help you identify your best current customer segments, we’ve broken the process down into five clear steps. Check in weekly as we walk you through each step, from setting up your project to performing customer data analysis, executing data collection, conducting customer segment analysis and prioritization, and implementing the results into your organizational strategy.
The next step in the customer segmentation process is to analyze and validate the segmentation hypotheses you have identified. This analysis will require significant data about your current customer base, so you will need to develop a data collection plan and a research process.
Once the necessary data have been collected, you can analyze and validate each of the hypotheses, helping to identify whether a segmentation idea is right or wrong. Having done so, it is also important to analyze the relationships between validated hypotheses. The synthesis of these segmentation schemes is an overall segmentation of the best customers that incorporates each of the validated segmentation hypotheses. That results in segments that are not only analytically proven to be attractive, but also intuitive and targetable for the purpose of developing and executing a segment-focused strategy against them.
Executing data analysis to identify relevant variables and validate your hypotheses
Now it’s time to analyze the data to validate or reject each segmentation hypothesis, and uncover the relationship between them. There are several different ways to do so.
Lightweight clustering analysis
If you have a small customer base, and/or a small list of segmentation hypotheses, one approach you can take is to conduct a lightweight clustering analysis by systematically reviewing the customer ranking relative to the hypothesized factors as follows:
- Create a table that lists all of the customer accounts you are analyzing together with their quality scores, as well as each account’s data fields that correspond to the segmentation hypotheses you have selected for testing.
- Sort the table by quality score and systematically go through the list of segmentation hypotheses to check if there is a correlation between the values in a segmentation hypothesis data field and the quality score. The relationship does not have to be one-to-one or even a linear correlation, but rather as simple as the following:
All customers with more than $5M in annual revenues are in the top 10 percent of the customer base, while all customers with less than $5M in revenues are in the bottom 20 percent of the customer base.
That observation is often enough to put some confidence behind the fact that characteristic X might be a good predictor of a customer’s quality.
Once a segmentation hypothesis appears to be validated using the steps above, sort the whole table according to the variable associated with that hypothesis. Doing so turns the analysis around to see if the segmentation variable in question is truly effective in separating great customers from the rest. This sorting process should lead to a clear segmentation of the customer base, where one segment is disproportionately represented by “good” customers.
By following the steps described above, you will have validated your segmentation hypotheses and provisionally reviewed the distinct segments formed by one or more of your hypotheses.
The second approach, listed below, can be used when you have more resources and time to spend on your analysis, or when there are many customer accounts to analyze.
Tree-based clustering analysis
Begin by slicing your data into quartiles by account quality score, such that your best quartile of customers is labeled “A” customers, and your bottom quartile is labeled “D.” If you are dealing with a large number of customers (i.e., hundreds) you can divide them into deciles instead.
Now look at the characteristics of each quartile (or decile), using averages for each proxy variable that you collected. In which variables do the A’s appear significantly different from the D’s? Are there any patterns that immediately jump out at you?
Taking the most obvious pattern in the data, the next step will be to create a branch in the data to illustrate this. For example:
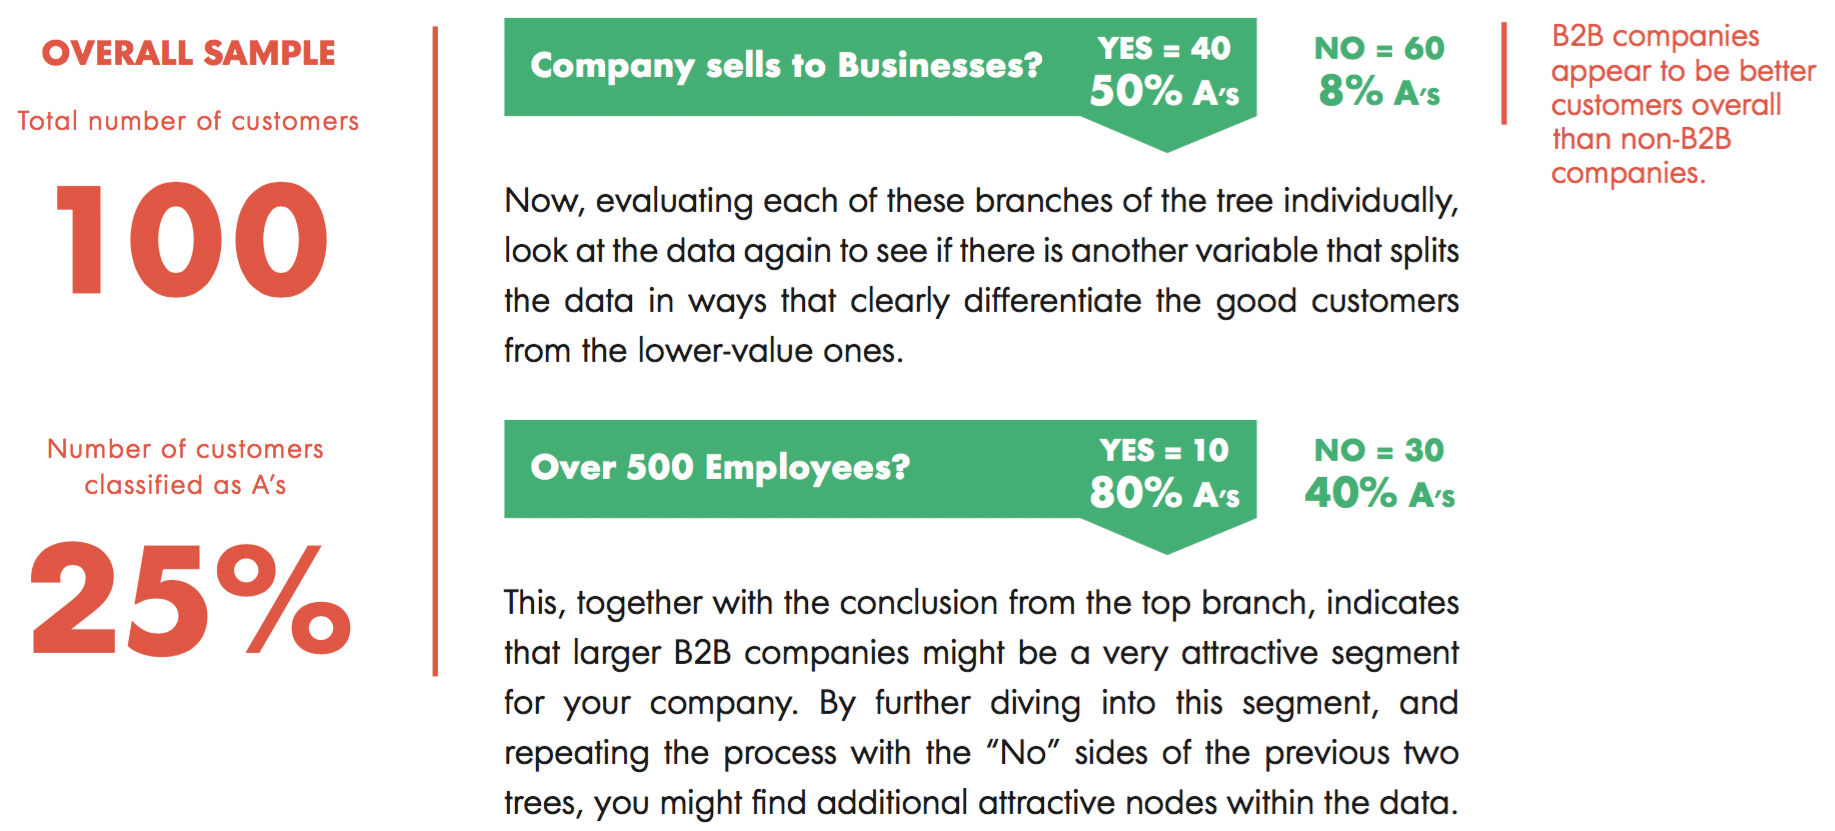
The end result will be a list of attractive segments for further analysis, which provides several advantages:
- It will serve as the basis for narrowing your regression analysis down to a few relevant variables.
- The tree is a visually appealing and logical way to look at the data, which will help you communicate your conclusions to stakeholders during the presentation phase of the project.
- It will help you determine cut-off points that regression analysis would not be able to properly capture.
There are some additional points to keep in mind during this stage of the analysis:
- The field you use as your first decision point (in the example above, “Companies selling to Businesses?”) is very important and can dramatically shape the rest of your decision tree. Try experimenting with different segmentation schemes to see if you can generate greater divisions at each decision point.
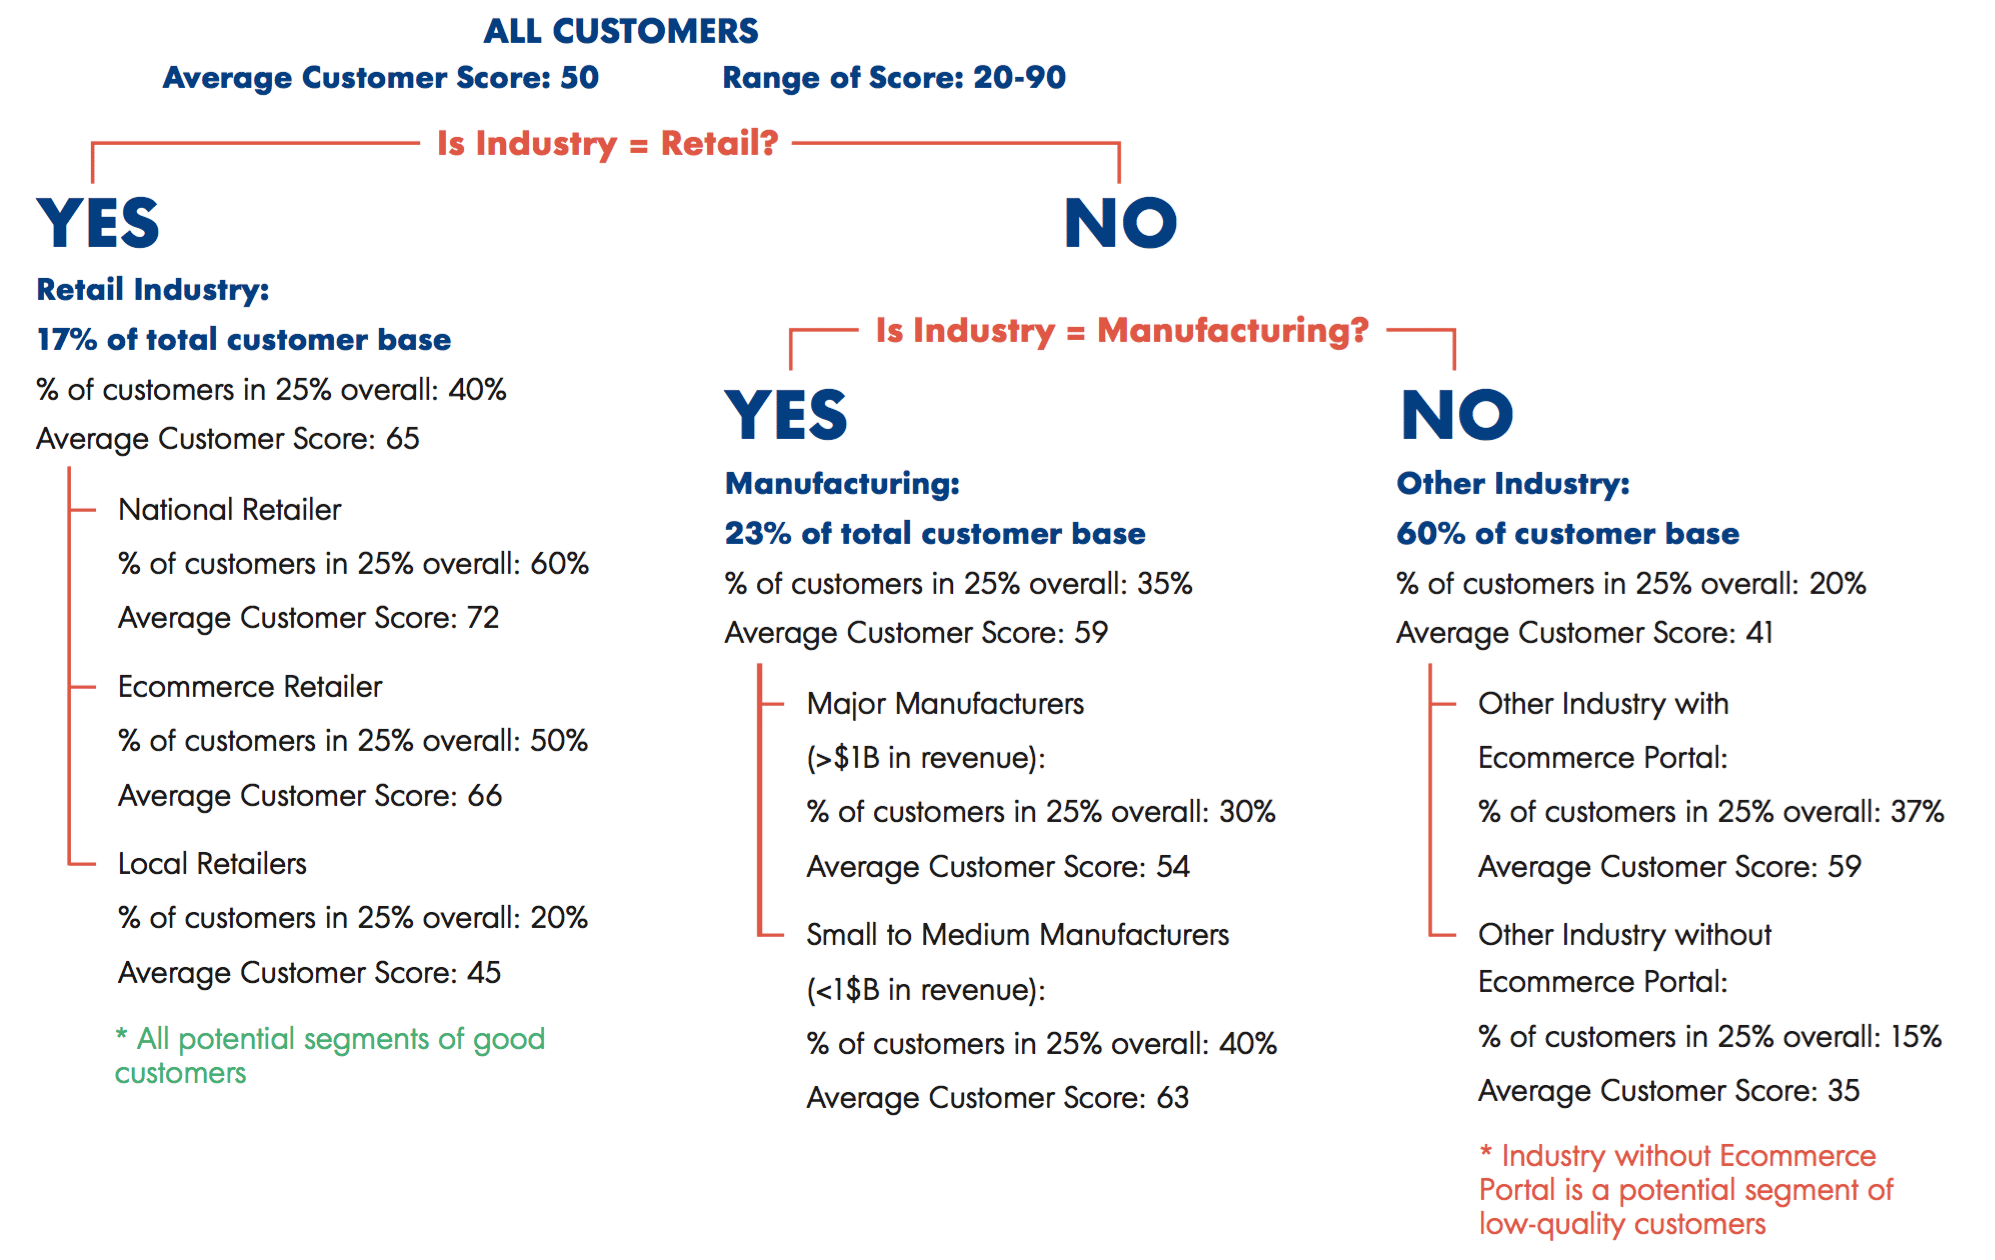
- In general, stop adding additional branches when the difference between the nodes stops being relevant or when the number of companies within each node becomes too low. For example, if you have segmented your list of 100 companies into a list of 50 different industries, a sample size of two for each industry will not be very convincing. You should either combine industries to create larger buckets, or consider segmenting based on another variable.
Below is an example of the full segmentation tree, after multiple iterations of the process described above.
Strengthening hypothesis validation with regression analysis
Once you find your segmentation variables using either of the methods described above, you can take the process one step further by numerically validating those hypotheses using regression analysis.
Start with a large set of variables—perhaps all of the ones that appeared relevant in the initial quartering of the data set. Run a multivariate regression against those variables with the account quality score as the dependent variable. The result of the regressions will allow you to identify variables that are insignificant (variables that do not correlate with the quality score in anyway), as well as variables that might be too closely correlated to each other to both be included in the analysis. Eliminate those variables and rerun the analysis until you have reached a set of variables that are all significant, and yet substantially independent of each other. These are the ultimate segmentation variables for the purposes of this project.
It may also be advantageous to run separate regressions for different segments that you identified in the previous data. For example, the previous tree illustrated that B2B companies segment nicely based on employees. However, it’s possible that B2C companies segment better based on another variable. Therefore, running separate regressions for B2B and B2C companies may produce better results than including them all in a single model.
Evaluating composite segmentation
Because value-based segmentation is a predictive process, any resulting segmentation schemes can be evaluated as if it is a predictive model of the customer’s quality. In order to come to the most appropriate segmentation scheme, we can compare the different composite segmentation schemes discovered using a technique called “lift charting.”
A lift chart shows the predictive power of a scoring model by comparing the likelihood that a customer with a high score on that model is also a good customer. Lift refers to the increase in probability that a customer that is scored highly by that model is actually a good customer, per historical data. If the model had no predictive power at all, the likelihood would essentially be that of a randomly chosen prospect, and its lift would be zero.
For example, using our segmentation scheme, we are effectively predicting whether a prospect will fall within the top 25 percent of our customer’s base, based on our recently established quality score. The way to measure this predictive power is to apply the predictive model to the existing customer base and see what percentage of the actual top 25 percent of customers fall within the top 25 percent of customers in that model.
Because the actual quality score incorporates information that is only available after a prospect becomes a customer, it is unlikely that we will be able to predict this perfectly, but the closer we get to correctly predicting the top 25 percent of customers, the better.
Extending this analysis further, we calculate the Y percent of the actual top 25 percent of customers captured by any given top X percent of the customer base as ranked by the predictive model in question. Calculate Y for each X from 0% to 100%, and then plot Y against X will give a line graph that is the “lift chart” of the model, as shown in the figure below.
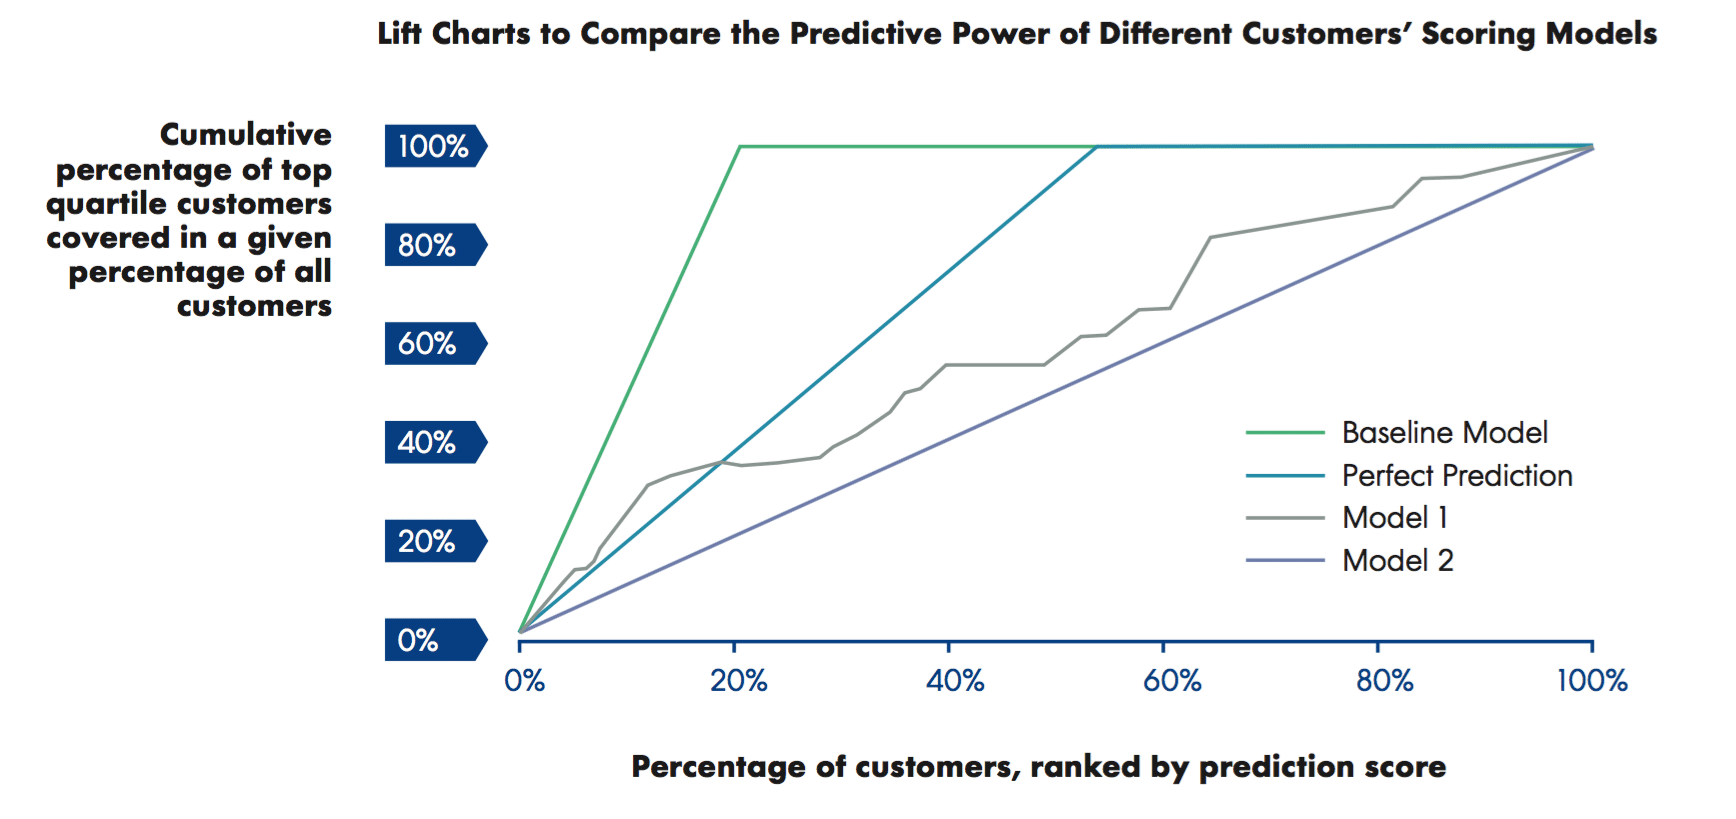
To understand how these charts help to visually compare the predictive models and the segmentation schemes that they are based on, first look at the worst and best cases.
First we have a baseline model, which is a straight line where the slope equals one. This is the model with no prediction at all—we need to review the entire customer base to identify the top 25 percent of the customer base. The perfect prediction model, on the other hand, assumes perfect prediction—the top 25 percent of the customer base according to that model coincides with the actual top 25 percent.
Model 1 and model 2 are imperfect models with slightly different lifts. Model one has better lift because it is higher above the baseline model, and is closer to the perfect prediction model. The top 50 percent of the customer base according to model one captures the actual top 25 percent. In contrast, the top 90 percent of the customer base according to model two captures the same actual top 25 percent. Model one clearly has more predictive power than model two.
Ultimately the results of your regression and lift chart analysis will likely be too technical and detailed to be included in your final presentation to your stakeholders. However, it is still important to perform this analysis to verify that the results of your decision tree are rigorously supported by quantifiable measures, to choose between alternative segmentation schemes, and to retain it as an appendix for anyone looking for additional insight into your methods.
Synthesizing validated segmentation hypotheses to form distinct, homogeneous segments of high-value customers
With your main segmentation variables identified, validated, and even stress-tested using both regression and lift chart analysis, you now need to develop a meaningful synthesis of these segmentation schemes and identify the most attractive targets.
The segmentation that you arrive at will most likely be a combination of the main segmentation variables, while the resulting segments will be defined by a combination of specific values of the segmentation variables. However, some of the segments you identify can also be merged together, and not all of the defined segments will satisfy the following list of desirable segment characteristics:
- The segments definitions are meaningful and intuitive. They make sense and do not require a lot of complex reasoning to be defined.
- The segments are well-defined and preferably demarcated by observable variables so that it does not take a lot of effort to classify the customer into the segments.
- The segments are addressable using modern communication and marketing tools (this typically follows the previous requirement).
- The segments are substantial enough (in terms of number of prospects or economic benefits) to be considered an integral part of strategy.
- The segments are sustainable and will continue to be a meaningful part of the market, growing at least as fast as the overall market.
The reason for listing the characteristics above is that they are what ultimately define actionable segments, as opposed to the analytically defined and validated segments that you might have developed through the previous analysis.
The main tradeoff in your selection and/or definition of segments based on the validated segmentation hypotheses is thoroughness versus practicality. For example, during the analysis stage, you may have identified half a dozen important characteristics that predict a customer’s success, all of which may interact in a complex way (for instance, B2B companies generally need to have more than 500 employees to be successful, whereas B2C companies can be successful with just over 100 employees). Incorporating that complexity fully into your segmentation plan can result in overly complicated, fragmented segments that are impossible to target and not scaled enough to be worth investing in the segmentation focus strategy.
To reduce some of this complexity, you should concentrate on a fewer number of segments that more fully satisfy the list of criteria above. While you will lose some accuracy by ignoring less important variables, your best insights will be much more powerful and useful to the organization. Thus, even though you might have validated many different hypotheses, you should work to synthesize them so that your final segmentation scheme depends on just a few segmentation variables. Having more variables will unnecessarily complicate the delivery of your results, and the subsequent efforts to target the identified segments.
Evaluating segment value, targetability, and size to prioritize your best segment(s)
Once you have reached a satisfactory overarching segmentation scheme, the last analysis to be done is to evaluate the resulting segments and prioritize the few that are most promising in terms of:
- Customer quality: Measured by the average customer score, this is the spread of the scores within all customers in that segment, as well the lowest and highest scores of customers in that segment.
- Segment size: A rough estimate of the total economic value of all the prospects that have characteristics as defined by the segment. A true segment sizing analysis is beyond the scope of the present document and is often unnecessary. Typically, you only need to find an approximation of the number of prospects in the segment, or the prevalence of prospects in the segment, to come to a reasonable understanding of the size of the segment.
- Segment growth: A rough indication of future trends relative to the size and attractiveness of the segment.
Typically, given the limited number of segments analyzed, and the distinction you have identified and sharpened in your analysis and synthesis of the segmentation scheme, the choice of the best segment is quite obvious. However, the feedback process might result in slight prioritization changes, as new factors are uncovered or incorporated into the prioritization process.
Furthermore, given that you should be primarily concerned with the most important segments, you should also focus your synthesis on defining the few segments that form a big part of your best customer groups. The number of segments depends entirely on the scope of the project and the way the results pan out. However, the segments you target probably should not represent more than 25 to 50 percent of the total customer base, so as to help you meaningfully narrow your sights on the more attractive targets.
Typically, this means really focusing on just two or three top segments in your final recommendations.
Step 5: Presenting and incorporating feedback
Our guide to customer segmentation concludes with tips for successfully presenting your findings to stakeholders and translating your data into action.
In order to help you identify your best current customer segments, we’ve broken the process down into five clear steps. Check in weekly as we walk you through each step, from setting up your project to performing customer data analysis, executing data collection, conducting customer segment analysis and prioritization, and implementing the results into your organizational strategy.
The last step in the best current customer segmentation process is to apply the customer quality measurement discussed in the first step to the aggregate customer set in each of the identified segments. Doing so will allow you to ensure that the customer segment(s) with the best overall customer quality is/are identified.
You are then ready to present your findings to your stakeholders.
Building your final presentation
Creating a final presentation is a significant undertaking, but it’s important for a couple of reasons:
- It facilitates the delivery of the insights—paired with the analysis results that support them—to the stakeholders and encourages them to rally behind its recommendations.
- It is a reference document to be used in the propagation of the segmentation insights in other teams/departments, particularly in the implementation of the segment focus strategy throughout the company.
An effective presentation typically has the following sections:
- Agenda: One slide to frame the content of the presentation.
- Executive summary: No more than two to three slides that summarize the key findings and recommendations.
- Additional summary for stakeholders: A recap of the original project goals, the agreed-upon methodology, and the main milestones that have been achieved in the project, as this information will help stakeholders quickly catch up and be comfortable with the next sections of the presentation. If possible, limit the time spent explaining the intricacies of the methodology, as this level of detail is not necessary for your stakeholders.
- Key insights: This should constitute the meat of the presentation. First, review the segments you selected in order of prioritization. Then, show how much better they are in aggregate than the general population of customers. Finally, show that focusing on these segments will generate fewer misses, but that the benefits of not targeting lower-value customers far outweigh any meaningful lost opportunities. You can use two sets of charts to illustrate this point:
- A chart showing how the top 25 percent (or any suitable percentage) of customers are dominated by the customers in the identified and prioritized segments (see the example below).
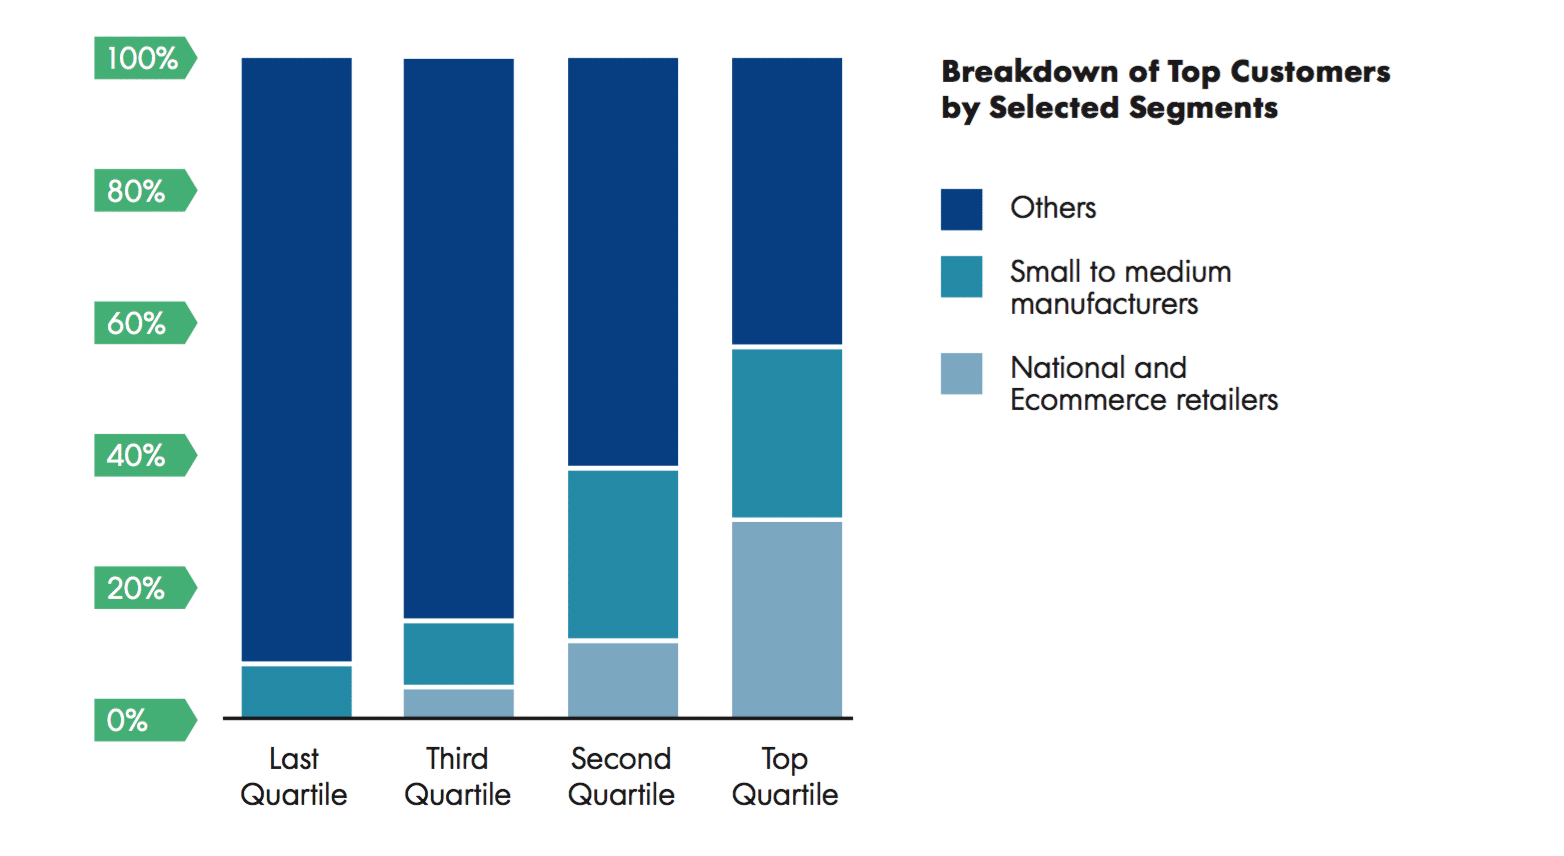
- A chart showing how each of the segments comprises a disproportionately high percentage of high-quality customers. For example, more than 40 percent of the customers in segment X are in the top 25 percent of all customers by quality score (see the example below).
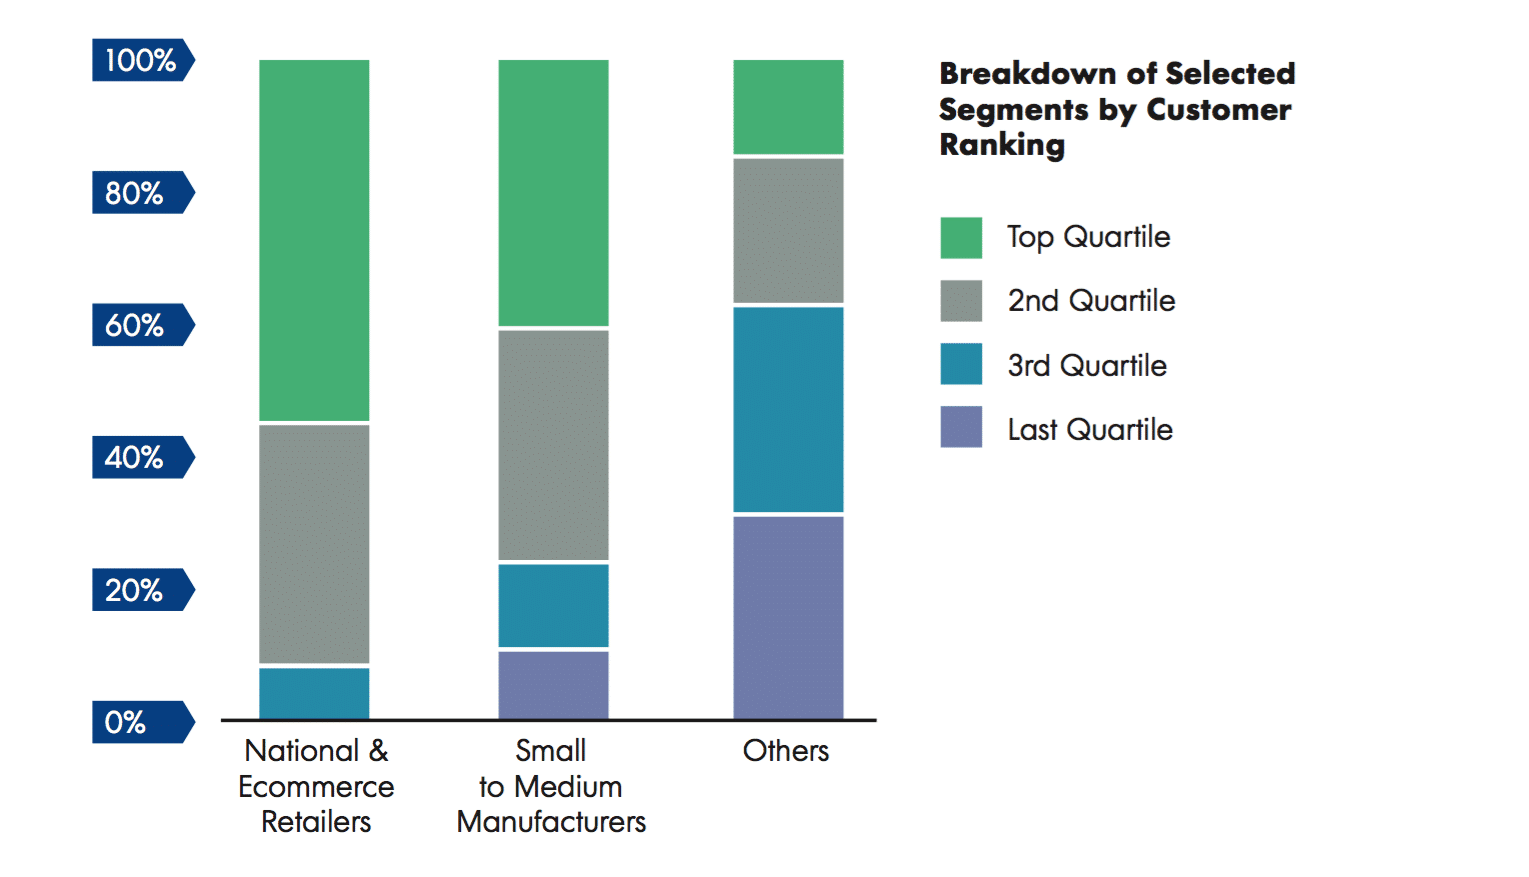
- To further illustrate the segment definition, provide examples and give the segment a catchy, easy-to-remember name.
- Methodology: After your message is clear, explain how you arrived at your results. Discuss the account score and show the top 10 and bottom 10 accounts, and explaining why they are scored that way. Additionally, cover the hypotheses you tested, and discuss the ones that you found out were not relevant. Very briefly, talk about gaps in the data or possible biases, and the results of your regression analysis.
- Next Steps: List out key next steps that will help ensure the impact of the project.
You first need to highlight the immediate next step, which is for stakeholders to give feedback to segmentation recommendations and approve/adopt the recommendations after the feedback has been satisfactorily addressed.
The steps that follow should be actions your organization can take to implement the segmentation recommendations delivered here. You may want to explain how each of the stakeholders can use the conclusions of your analysis. This may include aspects of whole product strategy, go-to-market strategy, sales, marketing, and even customer service. The object is to get all facets of your organization aligned to the target segments, and to make absolutely sure that existing customers in the segments are well served. You also want to ensure there is good coverage of prospective companies in the space on the part of your marketing and sales teams.
Gathering feedback
After giving your presentation, the stakeholders will likely have questions and feedback concerning the segments that you examined. Some of them will have had certain preconceptions about the business that may conflict with your conclusions, so anticipate the weaknesses in your argument and be ready to address them honestly and thoroughly. Too many un-resolved concerns about your methods can undermine the entire project.
If these concerns require adjustments to your data set in order to win the support of your stakeholders, it may be worth adjusting your methodology slightly to ease these reservations. Keeping track of your data files and strictly following the best practices in data versioning and management will allow you to go back to your files and make adjustment to respond to the feedback and questions without redoing a lot of work.
Ultimately, the project will only succeed if it gets broad-based support from the stakeholders, so the project may require several iterations before receiving such support.
Translating information into action
After completing the five steps laid out in this chapter, your business should have the critical best current customer segmentation data it needs to begin focusing on more productive—and profitable—segments. That data is only helpful if you put it into action immediately, however.
Like almost anything in business, the information you cull from this process has a shelf life, largely because any number of factors both within your company and your target market segment—can impact which companies constitute your “best” customers. As a result, it is important to implement the results of your best current customer segmentation research as quickly as possible, and measure their impact over time. As things change, it is a good idea to reconsider your best current customer segments and, if necessary, re-execute the process outlined above to adapt to those changes.
Putting this into practice
While this guide provides a step-by-step process for identifying, prioritizing, and targeting your best current customer segments, simply following it does not guarantee success. To be effective, you must prepare and plan for the various challenges and hurdles that each step may present, and always make sure to adapt your process to any new information or feedback that might change its output.
Plus, you can’t force-feed this process on your business. If the key stakeholders that will be impacted by the best current customers segmentation process do not fully buy-in, then the outputs produced from it will be relatively meaningless.
If you properly manage the best current customer segmentation process, however, the impact it can have on every part of your organization—sales, marketing, product development, customer service, etc.—is immense. Your business will possess stronger customer focus and market clarity, allowing it to scale in a far more predictable and efficient manner.
Ultimately, that means no longer needing to take on every customer that is willing to pay for your product or service, which will allow you to instead hone in on a specific subset of customers that present the most profitable opportunities and efficient use of resources. That is critical for every business, of course. But at the expansion stage, it can often be the difference between incredible success and certain failure.
Editor’s Note: This post was originally published on September 1, 2016.