Making Sense of the Hortonworks S-1: A Unique Economic Model
November 13, 2014
![]()
A Hadoop Pioneer with a Unique Growth Model
As I wrote about yesterday, an analysis of New Relic’s S-1 numbers revealed a rocket ship of a SaaS company that is literally firing on all cylinders. It’s growing extremely fast, fueled by the addition of new customers as well as the growth of existing customers, and the company is spending gargantuan amounts in both customer acquisition and product development. In short, what’s one way to describe New Relic’s strategy? “Go Big or Go Home.”
Hortonworks, which also filed on the same day, is also ostensibly a subscription-revenue driven software business at a very similar scale. Yet, as many people have pointed out, the margins and expense ratios for the company do not inspire a whole lot of confidence in industry observers who are more comfortable with the classic high margins, scalable software business models. In constrast, Hortonworks has low gross margins, and even makes a loss on its professional services offering. Overall, the company has historically lost $3 for every $1 of revenue it generates, and in just the first nine months of this year, it has lost almost $87M while generating just over $33M in revenue.
Losses and non-existent margins aside, Hortonworks does have very impressive top line growth, an incredible product in an incredibly fast growing market, and a solid set of channel partners that contribute very significantly to its revenue. All of these factors make it a very strong business with a leading position, and that is no doubt a key consideration in its S-1 filing. But will Hortonworks’ rather unique economic model work in the long run?
Analyzing the company’s historical financial performance presents a quandary, because it defies easy categorization — it does not ship proprietary software and it does not fit into the traditional license-based revenue model. It generates the majority of its revenue via a support subscription (not a software subscription), and the company gives away its product, the Hortonworks Data Platform, for free.
Among software/SaaS companies of a similar size or larger, it also has the largest dependence on professional services revenue. The only public companies with a somewhat similar setup are Veeva Systems and Tangoe, which are more industry-specific solutions. In terms of an actual comparison, there is perhaps only one big software company whose model comes close, and whose financial information is available for analysis and comparison — Red Hat, the original open source enterprise software company.
Breaking Down Hortonworks’ Numbers
Again, one way we can try to make sense of Hortonworks is by breaking down the components of its cost structure and comparing them with benchmarks for companies of a similar size. This time, instead of using the SaaS survey benchmarks from Pacific Crest and David Skok, we will be using S-1 filing data from recent IPOs of subscription-based software companies (to really compare apples to apples).
A side note on data sources and methodologies:
- Between 2010 and 2014, there were over 23 SaaS companies who filed for IPOs, and they typically went through the same historical milestones as Hortonworks did in scale of annual revenue: 10-20M, 20-30M, 30-40M, and 40-50M. This sample set reads like a who’s who of software companies, including ExactTarget, Marketo, Zendesk, Veeva, and HubSpot, among others.
- In each of these buckets, I’ve calculated the median value of the key financial ratios across all of these companies. Moreover, because not all of these companies have a large professional services component, I’m also calculating the median value of the same key financial ratios, but only for companies with at least 15% of revenue coming from professional services.
- The third comparative benchmark I’m using is Red Hat’s own financial ratios when it was at the same scale, based on Red Hat’s S-1 and annual SEC filings from the early 2000s. However, Red Hat’s data from that period is not fully representative of its current business model, as it grew by acquisition, and also had a consumer-oriented distribution model besides an enterprise-focused sales force.
- With both Hortonworks’ and Red Hat’s data, I’m using quarterly level data to make sure that we have data for each of the annual revenue run rate buckets. Lastly, given the data available, I did not have enough data in the filing to estimate their annual growth rate when they were at an annual revenue run rate between $15MM and $20MM.
That said, let’s dive into the data and see what it tells us.
Is Hortonworks Following the Same Growth Trajectory as Most Recent IPOs?
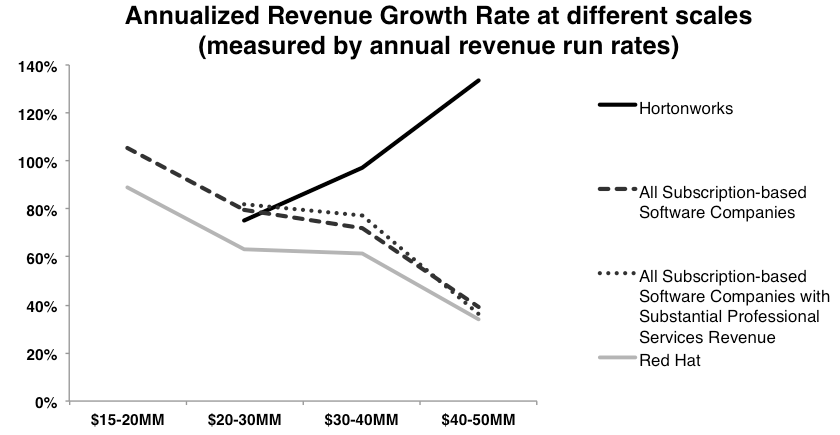
While the growth trajectories of the benchmark group of companies appear to be quite consistent, Hortonworks is bucking the trend. In fact, Hortonworks is actually accelerating its growth as it gains more scale, unlike most companies, which find it harder and harder to maintain the same growth rate as they gain scale. This is quite impressive even if we have to take some of the trends with a grain of salt, because there are just very few historical data points, given that the company is just a few years old.
Research and Development Cost as a Percentage of Revenue
To peel the proverbial onion back a bit more, let’s look at the drivers of its growth, in terms of product development and sales and marketing spending, represented as a percentage of annual revenue:
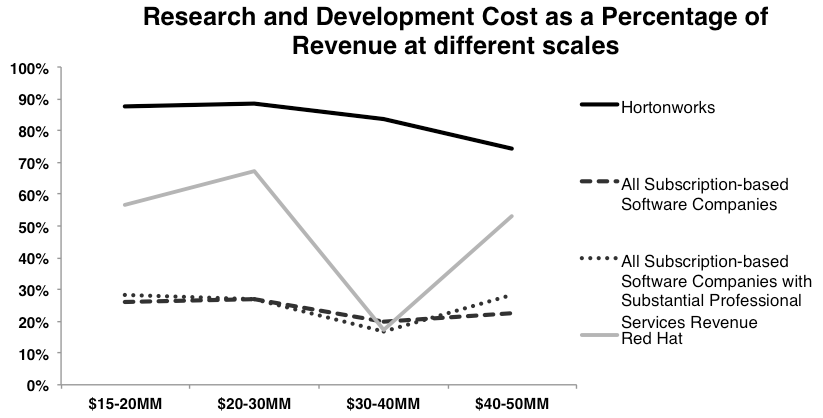
If there was a key takeaway from my breakdown of New Relic’s data from yesterday, it is that transformative, “seminal” companies like New Relic and Hortonworks can accumulate so much momentum and dominance in their market so quickly that the traditional “guard rails” of expense ratios really do not apply, even when compared to peers who are also fast growing, extremely successful companies.
It is interesting to note that at certain points in their growth path Red Hat also spent a lot more capital on R&D as compared to the overall benchmark, and this might indeed be a common characteristic of companies that are built on a Professional Open Source technology model.
Sales and Marketing Cost as a Percentage of Revenue
The divergence becomes even more pronounced when we look at the sales and marketing expense:
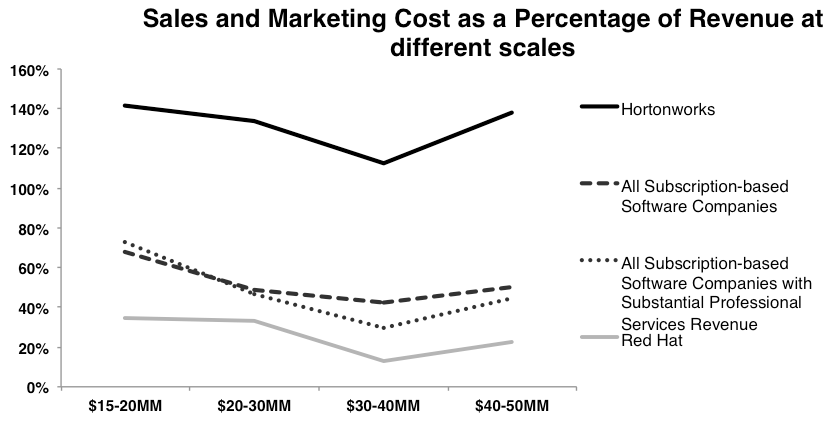
Hortonworks is spending at the level of companies 2-3 times its size — literally “punching above its weight” — ostensibly to acquire customers and maintain absolute product leadership. However, looking from another perspective, the company’s revenue is really lagging its overall scale in sales, marketing, and product development. That seems to indicate either it has not fully priced its product and services, and therefore is leaving too much on the table, or it just doesn’t have very efficient operations. The key question for Hortonworks’ long term viability as a business is whether it will be able to scale up its revenue sufficiently, while slowing down the growth of its operational expenses by making its sales and marketing operations more efficient.
Now, there is a practical limit to how many deals a sale team can generate, simply because much of sales and business development initiatives are activity and human resource intensive, especially in the enterprise segment that Hortonworks targets. Thus, optimizing sales activities can only improve the financial performance so far, and most likely will not be sufficient to bring Hortonworks’ expense ratios down to the industry norms.
Beyond operational efficiency, the other feasible way for Hortonworks to get a lot more revenue out of its sales and marketing operations is to charge more, or be able to aggressively grow the subscription billings for its existing customers.
The final ratio that we are benchmarking, Gross Margins, may help explain that idea further.
Gross Margins
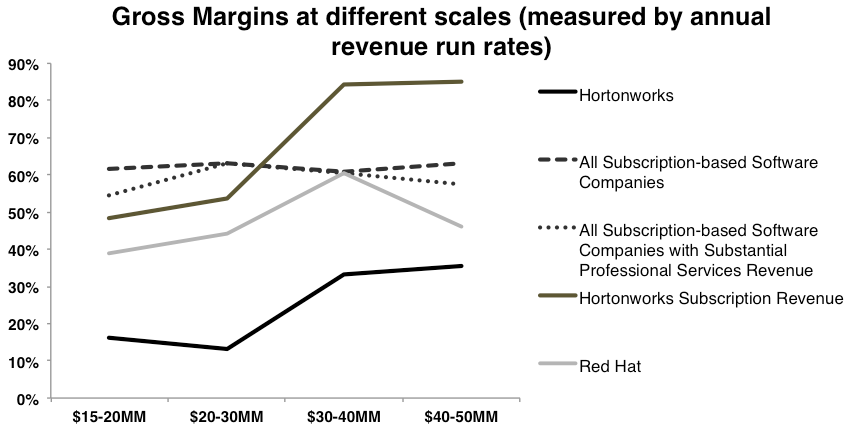
Hortonworks’ blended gross margins (both subscription and professional services) are very low compared to other software IPOs, even the subgroup that has heavy professional services segments. This is potentially indicative that Hortonworks is charging too little for their product and services, as well as giving a very deep discount to resellers and OEMs such as Teradata and Microsoft, which account for a significant portion of their revenue. This is probably a major reason why the company ends up with such an unattractive profitability profile.
However, there are two things that are going right for Hortonworks on the overall gross margins trends:
- The margins are increasing and can conceivably catch up with the industry norms in a couple of years.
- The subscription margins are actually quite good and are going up as well.
We only have a few data points for these trends, but if they hold up they are both proof that Hortonworks’ product and services offering can generate attractive margins at scale, and that the company is actually able to control its profitability and build a sustainable business in the long term.
Those two trends, together with the company’s breakneck, accelerating growth, may well be the salvation for Hortonworks’ success with its IPO and ultimately its business in the long term.
What Do You Think?
What is your prognosis for Hortonworks? Is there anything we miss in our analysis? Please participate in the comments section!
If you find this interesting, do hop over to my post with a similar analysis on the New Relic S-1 filing.