A Simple Framework for Pricing Your New Product. And Nailing it the First Time.
October 4, 2016
Established companies have ample resources and a deep bench of existing customers from which to gather data and make informed pricing decisions. Bootstrapped startups like you don’t have the same people, knowledge, resources and customers at your disposal. It becomes far harder to set a price point, let alone to foster full confidence that you picked the right price.
Since you’re most focused on getting your product launched and out the door, determining price is urgent. In order to get to that number faster, let’s drastically simplify the pricing decision and focus on getting to a dollar amount you can confidently stick on your first proposal. This will ignore a host of complex pricing decisions – packaging, value metrics, freemium, discounting, etc. We’ll get to those later, but for now, let’s focus on a number.

To decide on a launch price, you’ll need to quickly gather as much data as you can from four sources: industry benchmarks, competitive analysis, economic value analysis and market research. No data point is a single source of truth, rather you’ll want to stitch together the insights from across all four mixed in with the best judgment of your team.
Data Source #1: Industry Benchmarks
Your starting data point should be industry benchmarking based on the target segments you plan to go after. This arms you with a quick understanding of the range of ACV that your customers expect to pay, and that you can expect to charge. That said, the ranges can be quite wide, with prices depending on the level of buyer reached within the organization, how many users interact with the product and the breadth of the product offering.
To give you a leg up, we analyzed the 2015 10-K statements of 52 publicly traded SaaS companies to see what prices they were realizing. For each of the companies, we collected data on their target segment(s), annual revenue, number of paid customers and annual average revenue per customer (ARPC).
Across the 52 companies, ARPC ranged from $100 to a whopping $1.8M per year. Thankfully the range gets far more compressed when you hone in on target segments such as Enterprise, Midmarket and SMB (see chart).
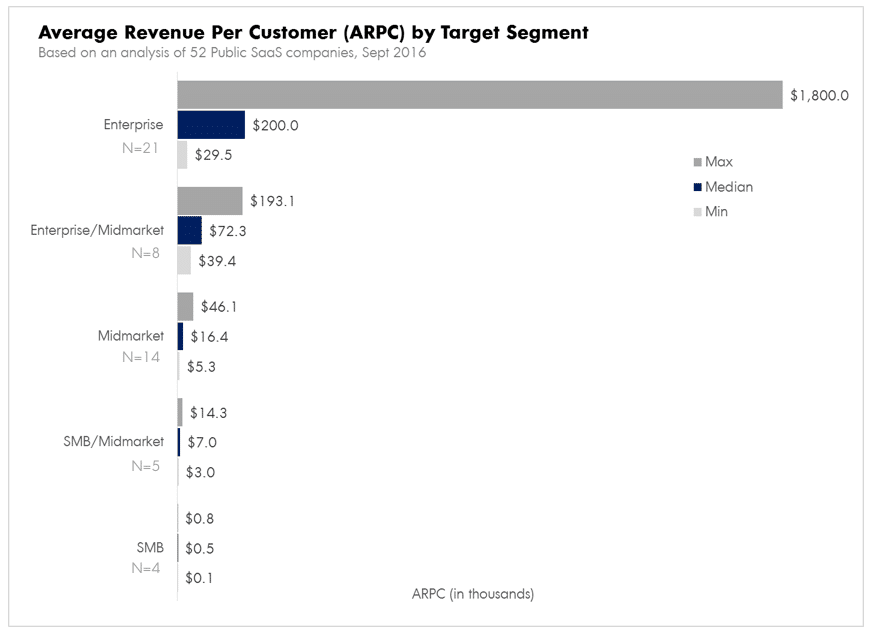
A plurality of companies, 21 of the 52, squarely target large Enterprises including Veeva, ServiceNow, Apigee and Medidata Solutions. As a working definition, Enterprise-focused companies tend to have in the hundreds of customers (or in the low thousands) with a strong focus on the Fortune 1000. Take Apigee as an example; they reference 260 clients including 30% of the Fortune 100, five of the top 6 retailers and five of the top 10 telecoms companies. Enterprise-focused companies go after a very thin slice of the market but more than make up for it by commanding a median ARPC of $200,000 (although it can swing from $29,500 up to $1.8M).
Meanwhile, 14 of the 52 companies target Midmarket buyers, which can either mean that the company only goes after the Midmarket or that their customers are evenly distributed from very small to very large. Midmarket-focused companies, such as HubSpot and LivePerson, achieve a median ARPC of $16,400, far below that of Enterprise-focused customers. It ranges from a low of $5,300 to a high of $46,100.
Purely SMB-focused companies were fewer and farther between, representing only 4 of the 52 companies in the study. These companies, like Xero and Constant Contact, earn a median of $500 per year, of $40 per month, from their customers. To make up for such a low ARPC, these companies need to chase a huge market and adopt an extremely cost-efficient go-to-market model.
Data Source #2: Competitive Analysis
To narrow your price range, conduct in-depth competitive analysis of your specific technology market.
For many innovative SaaS startups, there may not be a like-for-like product alternative. In those cases the competitive analysis should cover companies that you would consider to be peers rather than direct competition. If you are in the HCM space as an example, you should consider a whole plethora of technology solutions including Applicant Tracking Systems, CRM, Event Management Platforms, Job Distribution, Job Boards, Employer Branding and Career Sites. Your buyer will be doing the math on how much of their budget goes to your solution compared to the other key components of their stack, and so don’t forget to factor this into your pricing.
Gathering competitive intelligence on pricing can take on a number of forms. Online secondary research makes for the clearest starting point. Certainly check out pricing pages, but don’t stop there. You can find great information from company interviews in the press, 3rd party research reports, software review services like Capterra or G2 Crowd, database services like Siftery and even forums like Quora. For publicly traded companies, it is also worth reading through financial statements like 10Ks to search for their average revenue per customer and what customer segments they are targeting.
Data Source #3: Economic Value Analysis
Once you’ve understood the market and competitive landscape, you should layer in how much economic value your product creates for customers, or at least how much value you think it will create for customers. This typically comes in a few flavors: incremental revenue, reduced cost, reduced risk or time savings (increased productivity). For each you can attach a back-of-the-envelope dollar value.
Example: Your service is used 10 hours per user over the course of a month. Each hour of using the product shaves 50% of the time that the task would otherwise take. If the typical user is an executive and makes $125/hour, then you’ve saved the company $1,250/user/month (10 hours saved x $125/hour). If the typical user is a lower skilled employee and makes $15/hour, then you’ve saved the company only $150/user/month.
You will not be able to capture all of the economic value you create, and if you tried to your customers wouldn’t have much of an incentive to buy. The portion of it you can capture depends strongly on your ability to prove the benefit, the consistency of the economic value across customers and how much that benefit matters to your target customer. Capitalizing on the value of time savings may be critical for a business that pays its employees hourly, for instance, whereas it could be of little importance to a government agency.
Data Source #4: Market Research
The remaining data source, primary market research, helps you get specific buyer feedback on needs, value and willingness-to-pay. You have two main types of pricing market research at your disposal: qualitative and quantitative.
Qualitative research, in-depth 1:1 interviews with potential buyers, are most common in a B2B setting and when you have a relatively small universe of target customers. These typically last about 30 minutes each and can cover a wide array of topics. I recommend positioning these interviews as needs and value conversations, rather than “pricing” interviews. That helps put the interviewee in the right frame of mind, and protects against low-balling on price.
Towards the end of these interviews, after the prospective buyer understands and has provided feedback on the product and value proposition, you have an opportunity to ask pricing questions. The van Westendorp method, a common questioning technique, entails asking the interviewee a series of open-ended questions about what price they would expect for your product. While the proper technique involves four categories of questions, I focus on two: what would the buyer consider to be an “acceptable” price (good value for the money) and at what point the price would start to get “expensive” (they’d have to think twice about buying it). If the price you were thinking of is below what an average buyer considers to be “acceptable,” then you are likely leaving money on the table. If the price is above what an average prospect considers “expensive”, then you’ll probably face adoption hurdles and need to work especially hard at proving the value.
Meetup applied qualitative pricing techniques to help them set the launch price for their new and rapidly growing B2B product, Meetup Pro. According to Strategy Director Brian Lafayette, “We talked with existing customers about possible features, what would be most interesting to them, and how they were using Meetup for their existing groups. We also had the price discussion so we could begin to understand the different price thresholds.” Insights from their research led Meetup to a segmented pricing strategy that addressed companies that were willing to pay different amounts: large enterprises, small enterprises and startups/non-profits.
Quantitative research, or surveys with a large number of potential buyers, come in handy when you are targeting a larger universe of potential customers such as SMB’s or when your audience is diversified. These provide you with statistically significant data and allow you to compare and contrast responses across different segments of respondents. I recommend keeping surveys on the shorter side, typically under 15-20 minutes, to minimize the risk of survey fatigue and poor quality data.
A quantitative survey gives you more opportunity to use indirect pricing methods, such as conjoint analysis. With conjoint methods like CBC and ACBC, you show respondents sets of product configurations and price points and they choose which they would be most likely to buy. By testing a wide variety of options across a large sample of respondents, you can tease out the incremental utility and willingness-to-pay for different product features.
Indirect research methods like conjoint are more reliable than qualitative methods in allowing you to optimize price levels and forecasting outcomes across a population. On the other hand, they require much more time, skill and expertise to do correctly, and so rarely get applied in the start-up software world.
What comes next?
Even if you launched your product with limited data, the good news is that you still have time to collect additional data and improve your pricing over time. Now that you are having regular conversations with prospects, you have new data at your disposal which you can use to lower or raise prices from where you started. Your pricing strategy impacts nearly all important SaaS metrics, so don’t just ‘set it and forget it’.
Are you a SaaS company that recently launched a new product? How did you set the launch price and what results did you see? Let us know in the comments, we’d love to hear from you!