Why is LTV:CAC Still a Thing?
June 27, 2016
“Conventional wisdom has nothing to do with the truth…”
– Ben Horowitz
We are taught to believe that the LTV:CAC ratio is magical and helpful. It can also be confusing as shit, and a lot of smart people have written about its many complexities and nuances. Adding to the confusion, there are unhelpful benchmarks that everyone cites. Why is a 3x LTV:CAC ratio the appropriate benchmark? No one knows. It just is.
I’ve been reexamining LTV:CAC and I’m kinda over it. I find that there are a number of wrong assumptions inherent in the ratio, which makes it totally unhelpful to me. But by looking at cohort data, realistic customer behavior, and some fancy new metrics – I think we can help the LTV:CAC metric evolve and adapt.
Why Isolated SaaS Metrics aren’t Helpful
Everyone loves to write about SaaS metrics. These talking heads all give you a magic formula to use and a magic benchmark to target. But focusing on any one metric in isolation is foolish.
Examples:
- Your ARR grew from $1M a year ago to $4M today, but you raised a big Series A and you’re burning more than $1M/month.
- You can recover CAC in 2-3 months, but your customers all churn after 12 months.
- You have 0% churn and great cash flow, but it’s only because you require a 5 year contract paid up front and now your sales cycle is super long.
Or as Byron Deeter points out, there is more than one way to skin a cat:
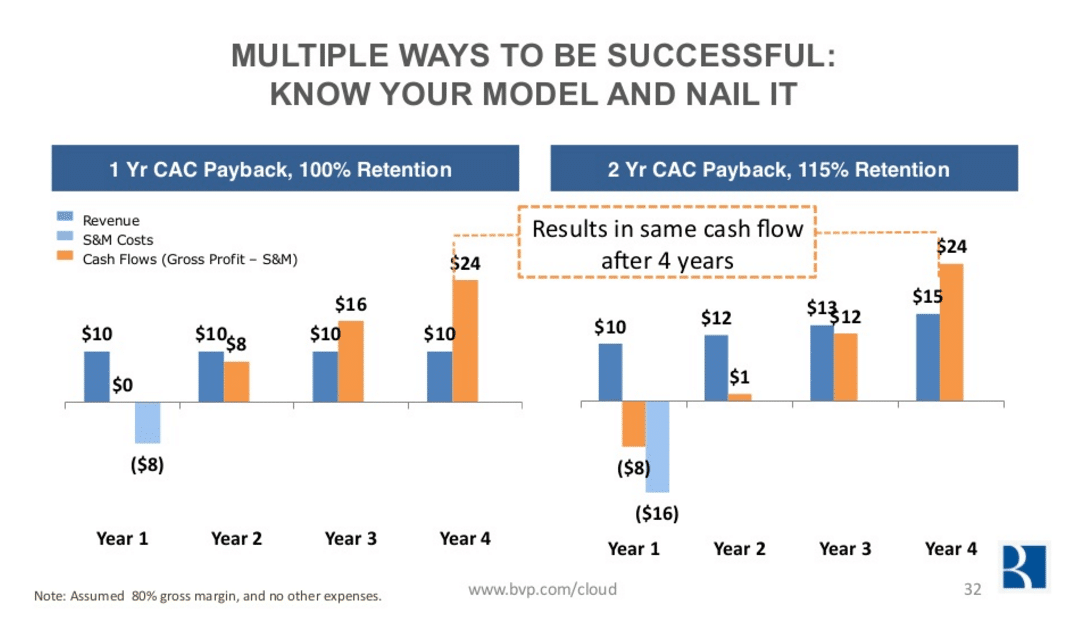
In the two scenarios Deeter shows above, someone overly focused on CAC payback would conclude the business on the right is terrible. This is the wrong conclusion, and it only becomes starker if you project out beyond Year 4.
The Standard LTV Formula is Wrong
Conventional wisdom LTV formulas make a couple big assumptions: (i) constant churn rates, and (ii) everyone eventually churns. Neither is true. Reality actually shows (i) decelerating churn, and (ii) some users are lifers. Rather than a straight line to 0%, this curve is more accurate:
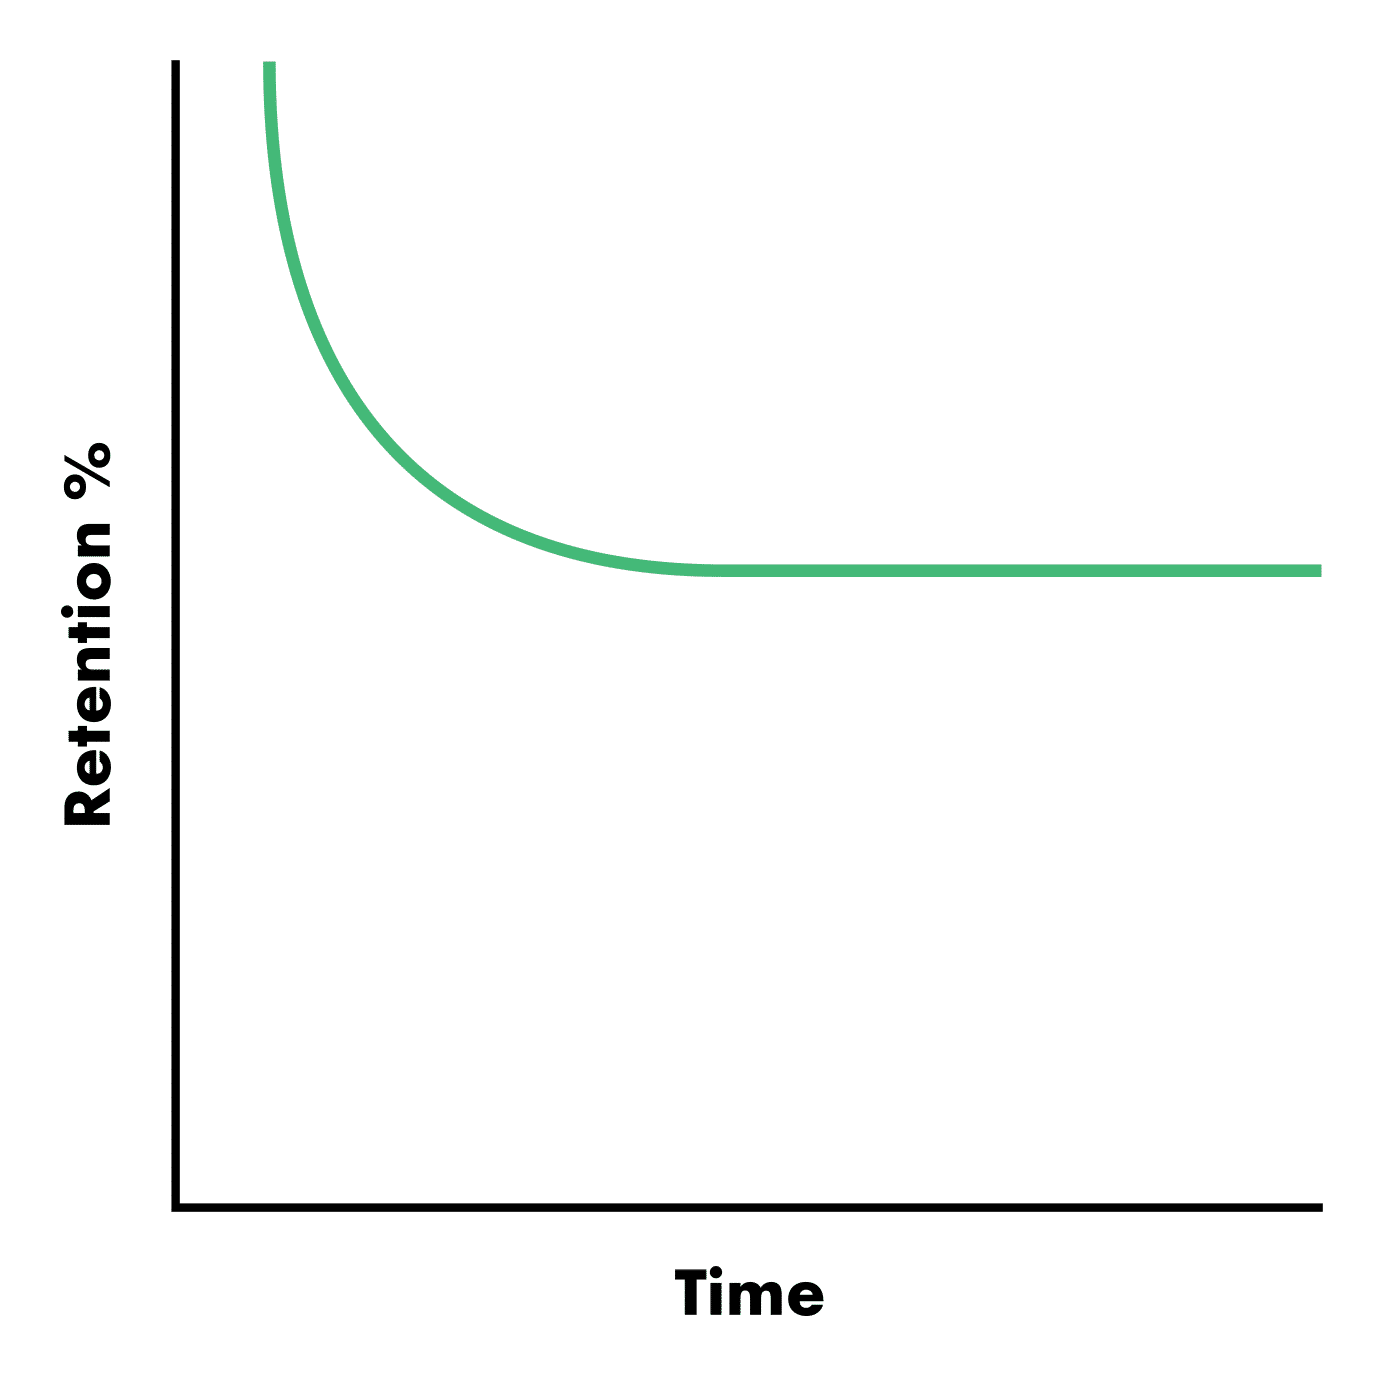
What does this look like in real life? Netflix. If you could get your hands on some Netflix cohort data, you’d see this type of curve. A bunch of people cancel after the first month. Then some more people cancel in the following months as they try it on for size. Then at some point over the next 18 months, I imagine, everyone left in the cohort is a lifer and the churn virtually stops. Think about it – what’s your expected lifetime as a Netflix subscriber? Me – forever.
According to Mr. Ropes who taught me math in high school, this is called an asymptote. And when a cohort goes asymptotic, it means that your LTV is actually infinite (even if it asymptotes at 5%). And math formulas get mad at you when you introduce them to infinity.
So yeah, actually calculating a definite lifetime (and therefore LTV) for even a moderately healthy business isn’t a thing you can really do.
Replacing LTV with a Real Thing
What do we do now that we have thrown LTV out the window? Let’s come up with a new metric that actually makes sense (because isn’t that exactly what everyone wants – yet another SaaS metric to remember?).
Before we get started with this SaaS metric creation business, let’s get one thing straight: Cohort-based analysis wins every time. There are too many things that can get skewed when you analyze things using aggregates or averages. For example, the basic monthly churn calculation:

This equation kind of works if all of your customers are month-to-month. But it breaks down if, like most good SaaS companies, (i) lots of your customers are on 12 month contracts, and (ii) you are growing really fast. The growth rate means the denominator is getting bigger, but the contract length means the numerator is basically a year old. What looks like a falling monthly churn rate could be the same old churn rate on time delay.
I won’t bore you with other examples. Just use cohort-based analysis because it’s simply more accurate. Monthly cohorts are the best, but quarterly cohorts can work too if your selling motion makes monthly data too volatile.1 Monthly revenue by cohort looks nice:
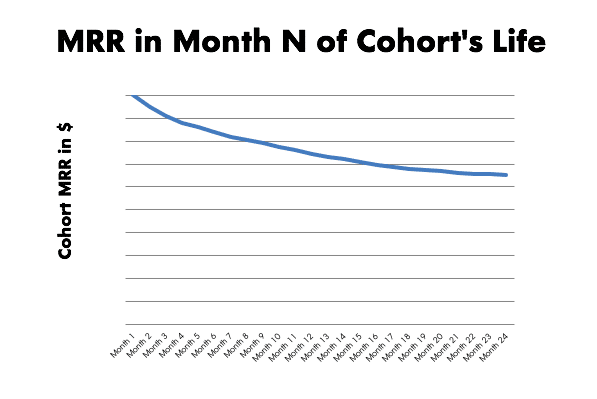
This data also makes it really easy to calculate churn – actual churn for the cohort, not a shittily calculated average churn %. Below, we see Month 12 retention is at 75% of Month 1 – so 25% gross churn in the first year, or roughly 2% monthly on average. But looking at Months 13-24, you see the asymptote come into play and the average churn rate falls to less than 1% per month.2

Once you have cohort data, you can easily calculate cumulative revenue over a period of time by adding Month 1 + Month 2…..+ Month N. It looks like this:
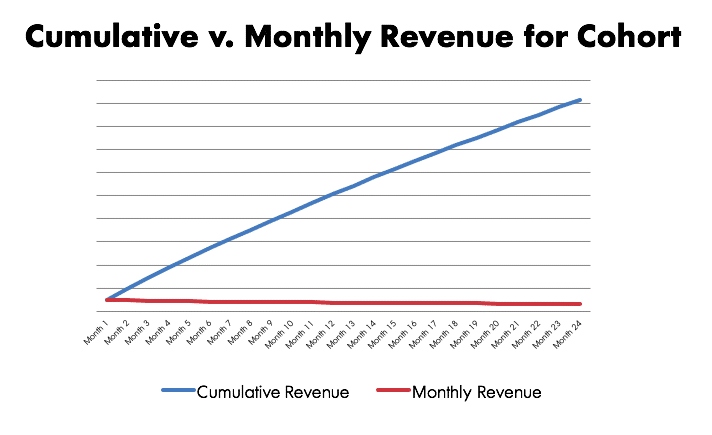
Now, since we’ve already established that LTV isn’t a thing, we need to figure out what to do with this ever-growing cumulative revenue line. First off, we should totally make it a new into acronym. We’ll call it CCR3 for “cumulative cohort revenue.”4 Regarding the x-axis, I suppose the best thing to do here is just slice CCR at different points in time – say 12 months or 24 months. Now you have 12 Month CCR, 24 Month CCR, and so on.
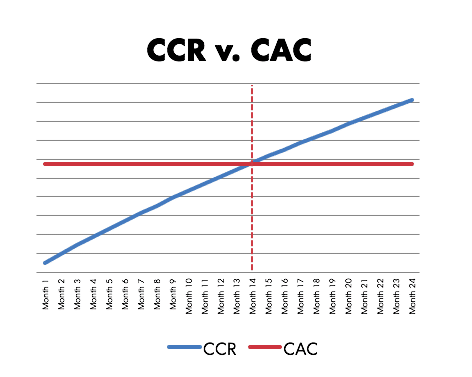
On its own, your “12 Month CCR” is just an arbitrary number. It becomes more helpful when you compare it to your CAC.5 It begins to illuminate breakeven by showing you when CCR intersects CAC. Below we clearly see the intersection or breakeven6 at Month 14.
We can now make this a referenceable ratio called the CCR ratio.7 But this ratio requires a time qualifier, since again, definite LTV isn’t a thing. So we can say “12 Month CCR Ratio” or “24 Month CCR Ratio.” Here’s the formula:

What is a Good CCR Ratio & How Do I Improve It?
The example above has a 12 Month CCR Ratio of 0.9x and a 24 Month CCR Ratio of 1.6x. What is good? Generally, I’ve found that anything greater than the corresponding # of lifetime years is an ideal benchmark. For example, >1x at Month 12, >1.5x at Month 18, >2x at Month 24, and so on.
There are two key variables at work in the CCR Ratio – (i) churn, and (ii) sales & marketing spend. Reducing churn is always a good idea. It is important here to remember to focus on the cohort retention curve – reduce churn rate and reach your asymptote quickly. Ideally, you’ll want to see that the slope of your successive retention curves gets more gradual and asymptotes at higher levels than in older cohorts.
Here’s another genius insight – reducing CAC is a good thing! However, it is important to focus on the right view of CAC. For the CCR Ratio, sales & marketing spend relative to your cohorts’ initial size8 is the key thing. “Relative” means there’s a correlated variable at play as well – if your cohort size grows faster than your sales & marketing spend – that’ll also do the trick.
What about Upsells?
The analysis shown above assumes no upsells, but we live in a world of MRR expansion and contraction. Looking at cohort data including upsells is great, and that’s what I typically do (this is how you can see if your company has “net negative churn” or MRR in Month N that is >100% of Month 1 MRR). You’ll have to figure out how to best attribute the sales & marketing expense associated with upsells in order to calculate CCR Ratio, but in the end, this is the Holy Grail.
In Conclusion
There are a lot of SaaS metrics out there, and then people like me are always trying to make up new ones in an attempt to be cool. There are a lot of people who write posts telling you what math formulas to use. Don’t take their word for it and start embracing a new metric because someone the crowd perceives as important wrote about it. Think about it and ask yourself, “Does this even make sense and is it relevant for my business?” If the answer to either of those questions is, “no,” then throw the metric away. Find one (or create one) that makes sense to you and is relevant to your business.
![]()
Appendix
- As a side note, saying, “We don’t track MRR because we are an ARR-or ACV-focused business with long-term contracts” is a super annoying thing to hear people say. Regardless of your target segment, contract length or sales cadence, you have a monthly P&L with a revenue line item on it. That monthly revenue is the roll-up of a revenue recognition schedule for each customer. Boom, there’s your MRR. Don’t agree? Try telling the IRS you don’t believe in ratably recognizing recurring revenue over the life of a contract.
- The obvious question you’re asking is probably, “What if my cohorts don’t have 12-24 months of data yet?” Good question, and there’s a good answer. But let’s avoid getting side-tracked and save it for a separate post.
- Do I need to make a reference to the band? I’d rather not, but you forced my hand, so just watch this.
- This could also be gross margin affected by multiplying the CCR by average GM % to get CCP (“cumulative cohort profit”), if that suits your fancy.
- When I say CAC, I mean total monthly sales & marketing spend. This is what you spent in total that month to acquire corresponding monthly cohort. Technically this would be “cohort acquisition cost” but one new metric is enough for now.
- Purists would argue this is not “breakeven” and you’d need to look at CCP or even cumulative contribution profit. Your call on how much of a purist you’d like to be.
- Because CAC:CCR is a mouthful.
- MRR in Month 1